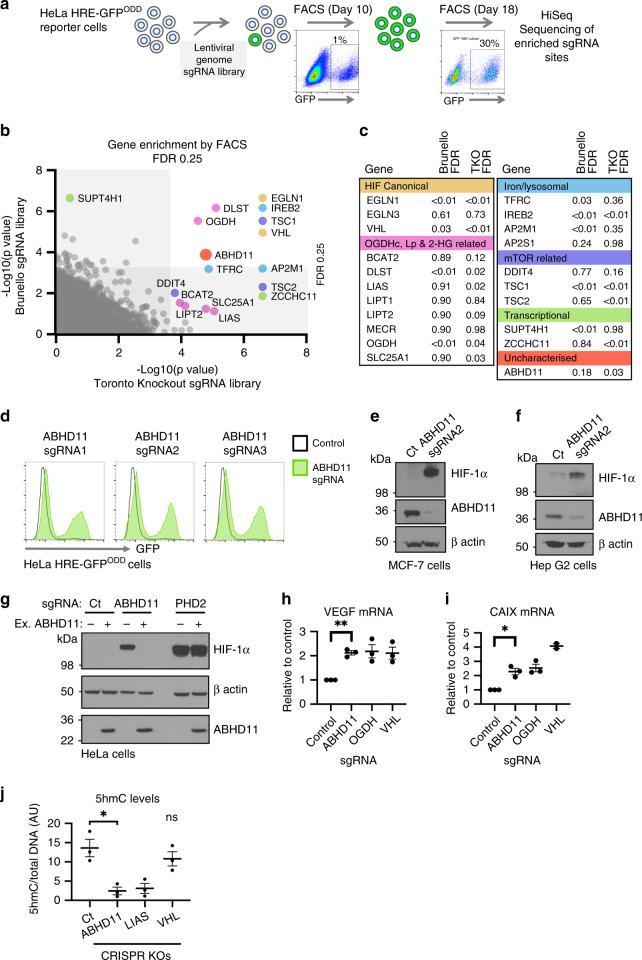
Fig. 1. Identification of ABHD11 as a mediator of 2-OG dependent dioxygenase activity.
a HeLa HRE-GFPODD cells were transduced and mutagenised with genome-wide sgRNA libraries (Brunello and Toronto KO). GFPHIGH cells were selected by iterative FACS and sgRNA identified by Illumina HiSeq. b, c Comparative bubble plot (b) and table (c) of sgRNA enriched in the GFPHIGH cells between the two genome-wide sgRNA libraries compared to a mutagenised population of HRE-GFPODD cells that had not been phenotypically selected. Genes enriched for sgRNA clustered into six main groups: (1) the canonical HIF pathway, (2) OGDHc, Lipoylation (Lp) and 2-HG related pathways, (3) intracellular iron metabolism (iron, lysosomal), (4) mTOR, (5) Transcription and (6) Uncharacterised. Unadjusted p value calculated using MaGECK robust rank aggregation (RRA); FDR = Benjamini-Hochberg false discovery rate (multiple hypothesis adjustment of RRA p value). EGLN1 = PHD2, EGLN3 = PHD3. d–f HeLa HRE-GFPODD (d), MCF-7 (e) and Hep G2 (f) cells stably expressing Cas9 were transduced with up to three different sgRNA targeting ABHD11. Reporter GFP or endogenous HIF-1α levels were measured by flow cytometry (d) or immunoblot (e, f) respectively after 10-13 days. Endogenous ABHD11 levels were measured by immunoblot and β-actin served as a loading control. g Reconstitution of mixed KO population of ABHD11 with exogenous ABHD11. HeLa cells expressing Cas9 were transduced with sgRNA targeting ABHD11 as described. Targeted cells were also transduced with exogenous ABHD11 with the PAM site mutated. Cells depleted of PHD2 served as a control for ABHD11 reconstitution. h–i Quantitative PCR (qPCR) of the HIF-1α target genes (VEGF and CAIX) in HeLa cells following ABHD11 depletion by sgRNA (n = 3, SEM, *p < 0.028, **p < 0.0065, two-tailed one-sample t test of ratio). sgRNA targeting OGDH and VHL were used as control for HIF-1α activation. j Genomic DNA was extracted from Hela control or mixed KO populations of ABHD11, LIAS or VHL, and 5hmC levels measured by immunoblot relative to total DNA content (Supplementary Fig. 1j). 5hmC levels were quantified using ImageJ. n = 3, Mean ± SEM **p = 0.010; ns:p = 0.39, VHL compared to control; two-tailed t test (not adjusted for multiple comparison). Ct = control.

