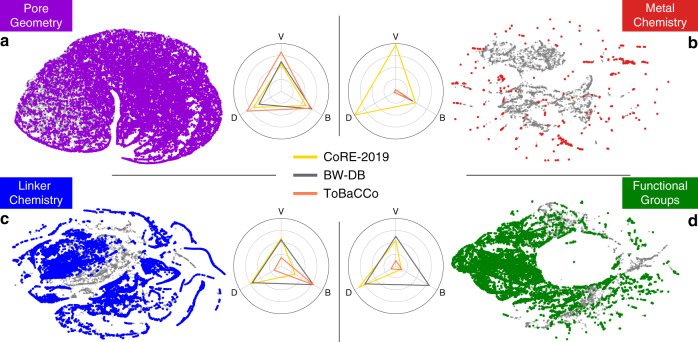
Fig. 3. Diversity metrics and maps of different domains of MOF structures.
The t-SNE method was used to project the a pore geometry, b metal chemistry, c linker chemistry and d functional groups descriptor spaces to 2D maps. Only descriptors up to the second coordination shell were included for metal chemistry to emphasize the local metal chemistry environment. In each panel, the structures from the hypothetical databases are coloured and overlaid on the entire known design space represented in grey. The radar charts show the three diversity metrics: variety (V), balance (B) and disparity (D), for the three databases. For this analysis, first we discretize the space into a fixed number of bins. Variety measures the number of bins that are sampled, balance the evenness of the distribution of materials among the sampled bins, and disparity the spread of the sampled bins (see the “Methods” section for more details).

