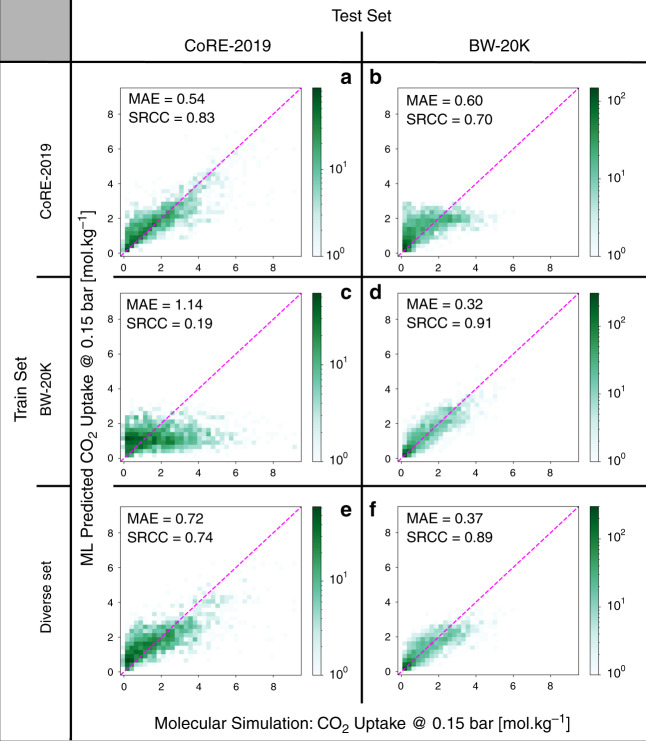
Fig. 5. Impact of diversity in training data on transferability of models.
The parity plots of random forest models using full features; rows and columns correspond to the training and test sets, respectively. The dashed lines represent the parity. The size of training sets is equal in all cases. The same structures were used as test sets in each column. The diverse set was selected using the MaxMin47 algorithm using all geometric and chemical descriptors. The colour bars show the number of structures in each cell of the histograms.

