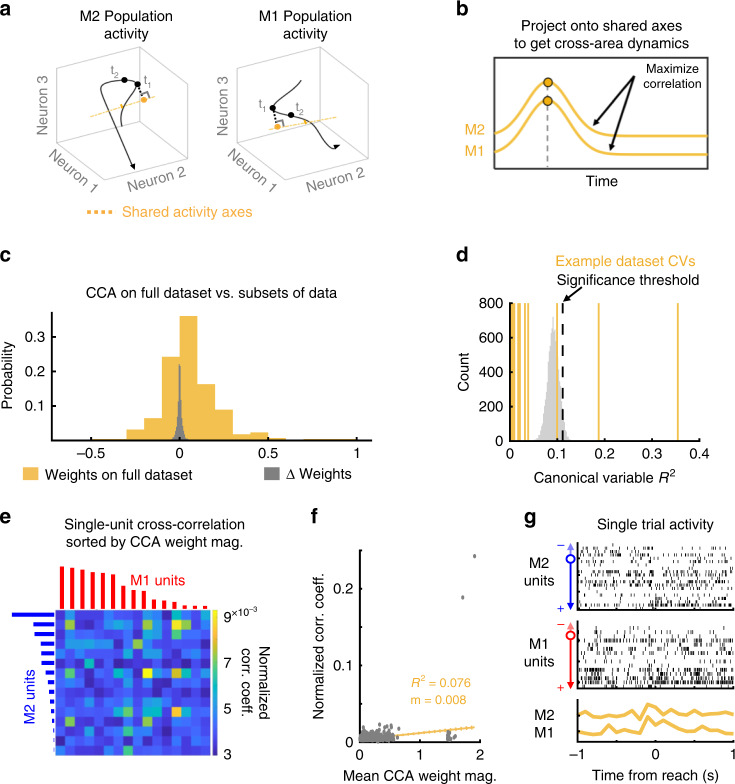
Fig. 2. Canonical Correlation Analysis identifies shared cross-area dynamics.
a Illustration of method for identifying cross-area dynamics. A multidimensional neural space can be defined using the activity of each M2 (left) or M1 (right) neuron as one dimension. Neural trajectories are shown in black (artificial data). Canonical correlation analysis (CCA, yellow) is used to identify shared axes, such that when the neural trajectories are projected onto these axes, as shown in b, the resulting trajectories, called cross-area dynamics, are maximally correlated between M2 and M1. The yellow dots for M1 and M2 illustrations are the projected values for the same timepoint in a. c In yellow, distribution of CCA weights when fitting on the full datasets. In gray, distribution of weights differences from ten subsamplings of each dataset (i.e., weight from subset − weight from full dataset). d Example identification of significant canonical variables (CVs, yellow lines), relative to trial-shuffled data (gray distribution, 104 shuffles). Significance threshold at 95th percentile of reference distribution. For this dataset, two CVs were significant. e Example comparison of CCA weight magnitude to single-neuron pairwise cross-correlations. M1 units (red) and M2 units (blue) are ordered by the absolute value of their CCA weight for the top CV. Color in the cross-correlogram indicates normalized peak correlation coefficient for timelags between −200 and +200 ms. f Across animals, pairwise cross-correlation is correlated with mean CCA weight magnitude for that neuron pair. g CCA identifies moment-to-moment shared covariation patterns that may be hard to see by eye in single-trial data. (Top) Population raster for an example trial in M2, where each row is a single neuron, sorted by CCA weight. (Middle) Population raster for the same trial in M1, sorted by CCA weight. (Bottom) The M2 and M1 cross-area dynamics for that same trial. The R2 between the M2 and M1 cross-area dynamics on this example trial is 0.3733.

