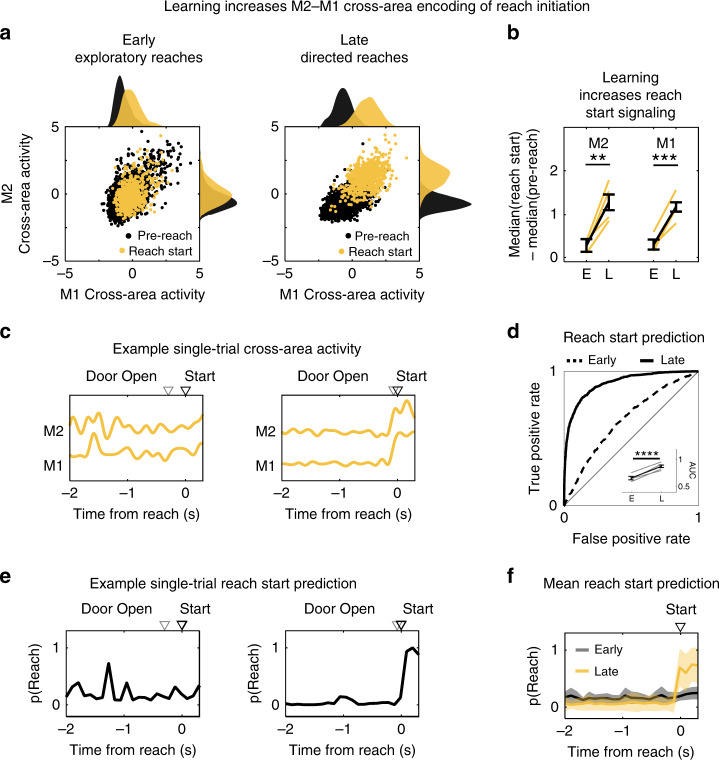
Fig. 4. Learning increases cross-area representation of reach initiation.
a M2–M1 cross-area activity before reach and during reach initiation for example animal, in early (left) and late (right) learning. Probability density functions of M1 (top) and M2 (right). Pre-reach activity in black. Reach start activity in yellow. b Quantification of (a) as the difference between pre-reach and reach median activity during early and late learning for M2 (p = 0.0017) (left) and M1 (p = 0.00053) (right) cross-area activity. Yellow lines show values for individual animals, black line shows mean ± SEM, n = 4 rats. **p < 0.01; ***p < 0.0001; two-sided t-statistics, not adjusted for multiple comparisons. c Example single-trial M2 and M1 cross-area activity before and during reach initiation. (Left) Early learning. (Right) Late learning. Time to reach initiation is indicated by triangles marking door opening (gray open triangle) and reach start (black open triangle). d ROC analysis of detection of reach initiation from M2 and M1 cross-area activity using logistic regression (example animal). (Inset) Difference in reach detection with learning quantified as the area under the curve (AUC) for all animals (p = 6.63 × 10⁻⁵). Gray lines show values for individual animals, black lines show mean ± SEM, n = 4 rats. ****p < 0.0001. two-sided t-statistic, not adjusted for multiple comparisons. e Example single-trial prediction of reach initiation using the models built in d, same trials as c. (Left) Early learning. (Right) Late learning. f Comparison of mean prediction of reach initiation during early (gray) and late (yellow) learning for example animal. Shaded region shows SEM, n = 4 rats.

