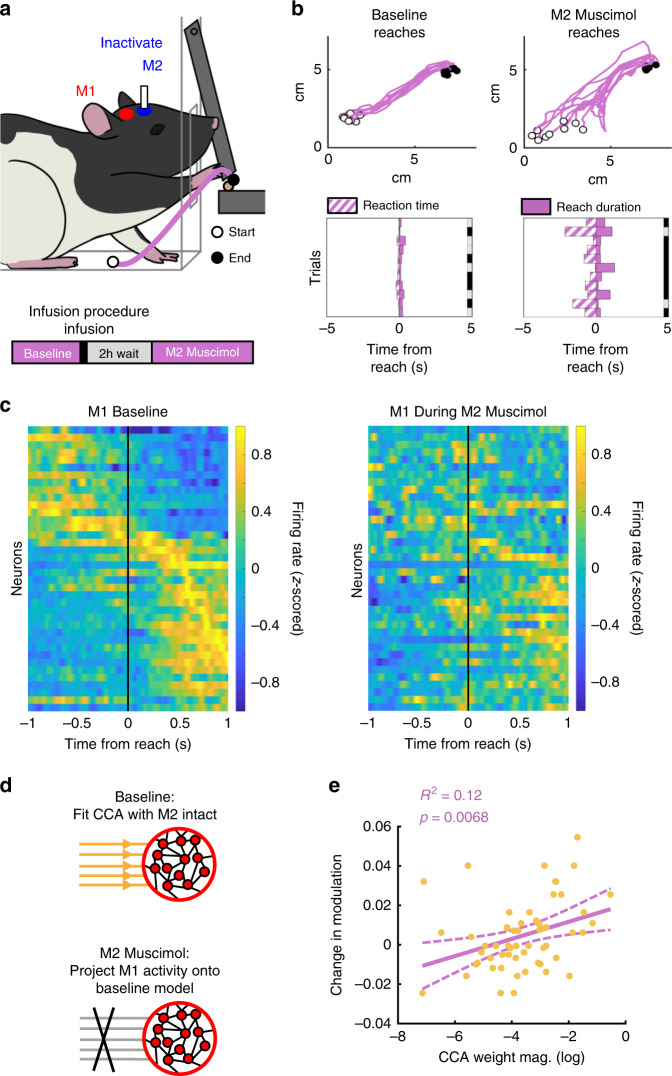
Fig. 7. M2 inhibition disrupts learned reach behavior and M1 single-unit movement modulation.
a Rats previously trained on the reach-to-grasp task were infused with muscimol in M2. (Bottom) Experimental paradigm for evaluation of reach behavior during M2 inactivation (see Methods). b (Top) Example reach trajectories during baseline (left) and M2 muscimol (right) trials. White dot marks reach start position. Black dot marks reach end position. (Bottom) Example consecutive single-trial representations of reaction time (purple striped bars) and reach duration (purple bars) for baseline (left) and M2 muscimol inactivation (right). Right border of plot shows accuracy, with success in gray and failure in black. c Population PETH for M1 units across n = 3 rats during baseline (left) and muscimol inactivation (right). Each neuron’s PETH was tested for trial modulation during the baseline period using a circular shuffle test. Only neurons that were significantly modulated during the baseline period are shown, ordered by their peak time during the baseline period in both plots. Firing rates are z-scored per-neuron. d Due to the same-day inactivation paradigm, CCA weights could be computed for the baseline session, and then used with the M1 data recorded during the M2 muscimol session. e Across animals, for each neuron (yellow dot), the change in task modulation between baseline and M2 inactivation was computed (baseline − M2 muscimol), and compared with that neuron’s absolute value CCA weight from the baseline period. The regression fit (purple) shows that neurons with higher magnitude CCA weights tended to have larger drops in modulation. Two-sided t-statistic, not adjusted for multiple comparisons.

