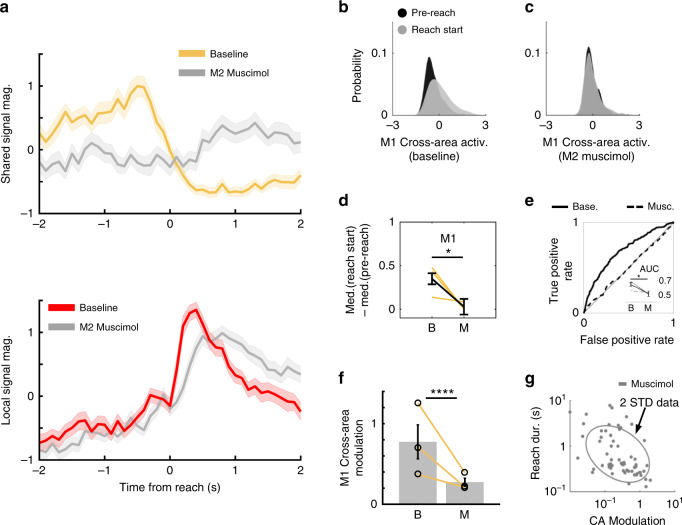
Fig. 8. M2 inhibition disrupts M1 cross-area movement modulation.
a (Top) Comparison of z-scored, trial-averaged M1 cross-area activity magnitudes during baseline (yellow) and M2 inactivation (gray) for one example animal. M1 CCA weights were defined during baseline period and used to calculate cross-area activity during both baseline and M2 inactivation trials. Solid line shows mean and shaded region shows standard error of the mean. (Bottom) As above, but for M1 local signals during baseline (red) and M2 inactivation (gray), suggesting that local signals are not as impacted by M2 inactivation. n = 91 trials for Baseline, n = 92 trials for M2 Muscimol. b Probability density function of M1 cross-area neural activity during baseline trials. Pre-reach activity in black. Reach start activity in gray. c As in b, but during M2 inactivation trials. d Quantification of (b, c) as the difference between median pre-reach and reach activity during baseline and M2 inactivation trials in M1 cross-area subspace. Yellow lines show data from individual animals, black line shows mean ± SEM, n = 3 rats. p = 0.02. *p < 0.05. two-sided t-statistic, not adjusted for multiple comparisons. e Detection of reach initiation from M1 cross-area subspace activity using ROC analysis on logistic regression model (example animal). (Inset) Difference in reach detection quantified as the area under the curve (AOC) for all animals. Gray lines show data from individual animals; black lines show mean ± SEM, n = 3 rats. p = 0.02. *p < 0.05. two-sided t-statistic, not adjusted for multiple comparisons. f M1 cross-area activity (CA) modulation decreases significantly with M2 inactivation. Yellow lines, also marked with black open circles, show data from individual animals, bars show mean ± std dev., n = 3 rats. ****p < 0.0001. One-sided hierarchical bootstrap, not adjusted for multiple comparisons. g Single-trial M1 CA-modulation predicts single-trial reach duration even during M2 inactivation. Plot shows random subsampling of trials across animals, all trials were used in quantification.

