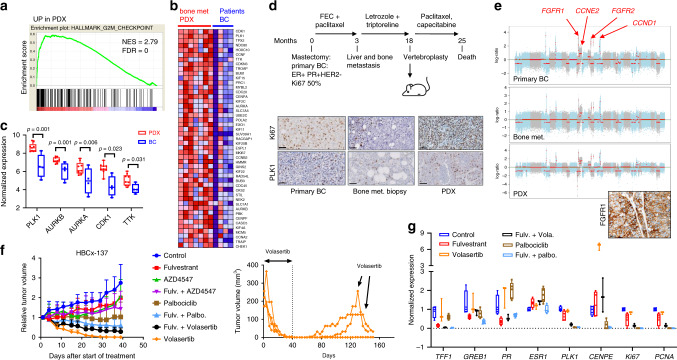
Fig. 1. Up-regulation of mitotic genes in PDX established from bone metastases and response to PLK1 inhibition in the HBCx-137 PDX.
a GSEA enrichment plots corresponding to hallmarks G2/M checkpoint. The analysis was performed on RNA from seven PDX and four primary breast tumours. NES normalised enrichment score, FDR: false discovery rate. b Heat map of gene expression changes in the G2 M hallmark. c Up-regulation of mitotic genes transcripts in bone metastasis derived PDX (n = 9) as compared to patient’s primary tumours (n = 4) (min to max whiskers plots with line indicating the median). d Clinical history of the patient corresponding to HBCx-137 PDX. The patient was diagnosed with ER + PR + breast cancer highly proliferating (Ki67 35%) at 52 year old. Lung and bone metastases were detected only 3 months after the start of adjuvant chemotherapy. She was treated by letrozole and triptorelin before vertebroplasty and PDX establishment. Immunohistochemistry analysis of Ki67 and PLK1 in primary breast tumour, bone metastasis and PDX (Ki67 H-score were 35%, 10% and 95% respectively, and PLK1 H-score were 6, 15 and 25%). Scale bar 50 μm. e Genomic profile of primary tumour, bone metastasis and PDX assessed by whole-exome sequencing. The three tumours carry focal amplification of FGFR1, FGFR2 and CCND1 and CN gain of CCNE2. FGFR1 expression has been validated by IHC in the HBCx-137 PDX (95% of positive cells). f In vivo targeting of HBCx-137 PDX by volasertib (10 mg/kg 4 times/week), palbociclib (75 mg/kg 5 days/week) and AZD4547 (12.5 mg/kg 5 days per week) in monotherapy and in combination with fulvestrant. n = 5 independent xenografts (control, fulvestrant, AZD4547, fulv. + AZD4547), n = 7 (volasertib), n = 8 (fulv.+vola), n = 9 (palbo, palbo + fulv.). Mean ± SD. Volasertib treated xenografts were monitored after end of treatment to detect tumour recurrence. Two xenografts relapsed at day 70 and 100 and were rechallenged with volasertib. g RT-PCR analysis of ER regulated genes (TFF1, GREB1 and PR), ESR1, PLK1, Ki67, PCNA and CENPE in treated tumours. Min-to-max whisker box plots with line indicating the median, n = 4 independent xenografts for all groups, with the exception of volasertib where n = 3 (xenografts were sacrificed before complete response for these xenografts). Source data from c and g are provided as a Source Data file.

