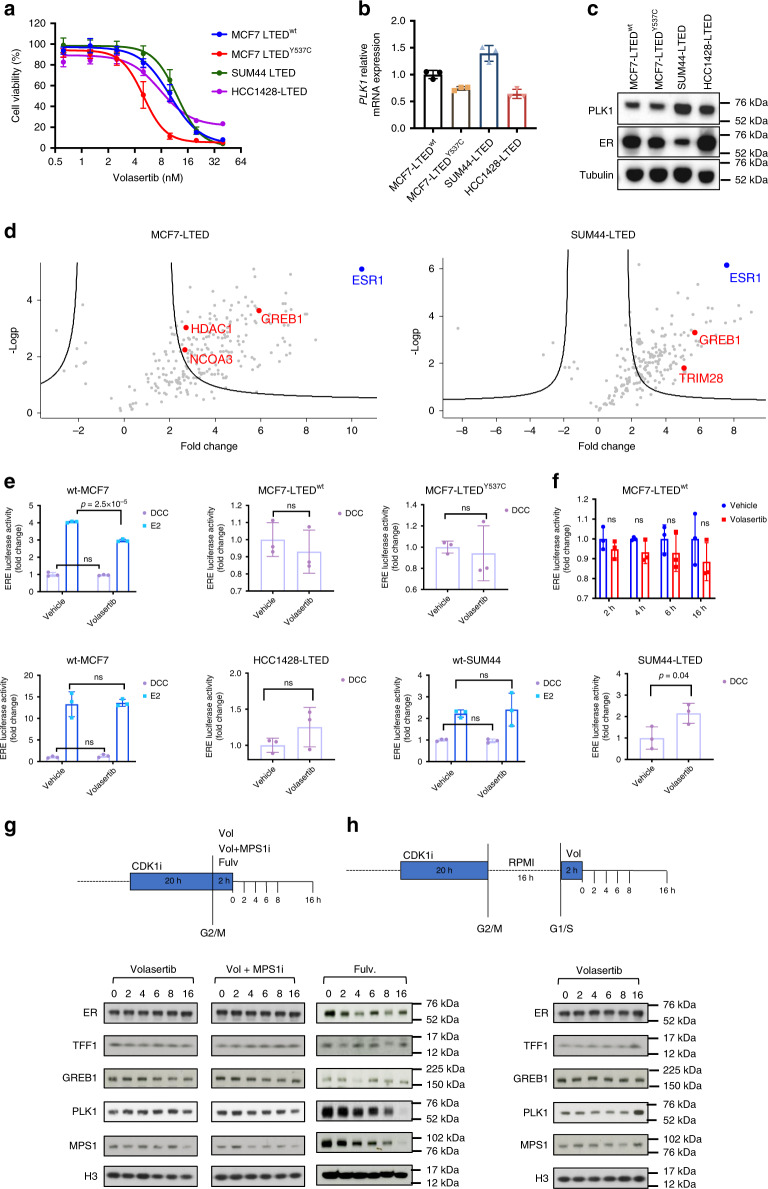
Fig. 6. In vitro studies of volasertib and siRNA against PLK1.
a Effect of escalating doses of volasertib on proliferation of MCF7-LTEDY537C, MCF7-LTEDwt, SUM44-LTED and HCC1428-LTED cell lines. Cell viability was analysed using a CellTiter-Glo assay and represented as percentage of vehicle control. Error bars represent mean ± SEM. n = 6 independent biological samples b Relative mRNA expression of PLK1 in MCF7-LTEDY537C, MCF7-LTEDwt, SUM44-LTED and HCC1428-LTED cell lines. Data assessed by RT-qPCR and represented as relative to MCF7-LTEDwt. n = 3 independent biological samples. Error bars represent means ± SD. c Immunobloting depicting changes in expression of ER and PLK1 in MCF7-LTEDY537C, MCF7-LTEDwt, SUM44-LTED and HCC1428-LTED cell lines. d Label-free quantitative analysis of ER interacting proteins in MCF7-LTEDY537C and SUM44-LTED cell lines. Volcano plot representing the logarithmic ratio of protein LFQ intensities in the RIME experiments plotted against negative logarithmic p values of the t test performed from triplicates (FDR threshold = 0.01, S0 = 2). ER and known interactors are highlighted in blue and red dots, respectively. e ER/ERE transactivation of wt-MCF7, MCF7-LTEDY537C, MCF7-LTEDwt, wt-SUM44, SUM44-LTED, wt-HCC1428 and HCC1428-LTED. Cells were transfected with an ERE-linked luciferase reporter and pCH110 (b-galactosidase control) and the following day treated with vehicle or volasertib (40 nM). Data expressed relative to vehicle control. Relative mRNA expression of oestrogen regulated genes TFF1, PGR and GREB1 after treatments with siControl or siPLK1 in several models of endocrine sensitivity. Expression assessed by RT-qPCR. n = 3 independent biological samples. Two-sided t test, no multiple comparison. Error bars represent mean ± SEM. f ER/ERE transactivation of MCF7-LTEDwt after transfection with an ERE-linked luciferase reporter and pCH110 (b-galactosidase control) and treatment with vehicle or volasertib (50 nM) for 2, 4, 6 and 16 h. Data expressed relative to vehicle control. n = 3 independent biological samples, interleaved scatter bars (mean ± SD) Two-sided t test. g, h Immunobloting assessing timecourse changes in protein abundance after release of 2 h treatment with volasertib (50 nM), fulvestrant (100 nM) or combination of volasertib and MPS1 inhibitor (150 nM), g without or h with medium synchronisation for 16 h. Source data are provided as a Source Data file.

