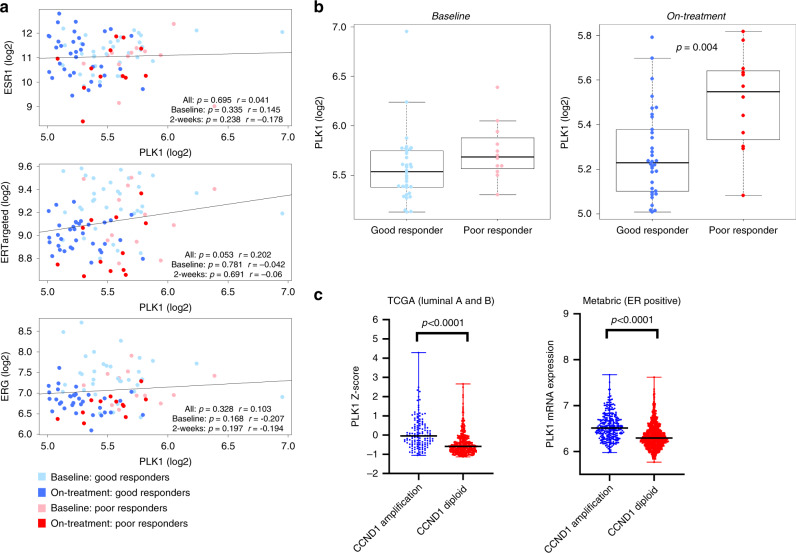
Fig. 7. PLK1 correlation plots in clinical samples.
a Correlation plots between PLK1 and ESR1, ERTargeted or ERG metagenes. Light blue dots—good responders at baseline; light red dots—poor responders at baseline; dark blue dots—good responders on-treatment (2 weeks); Dark red dots—poor responders on-treatment (2 weeks). Pearson correlation coefficients are shown. b Boxplot (box representing the median, first and third quartiles; whiskers representing min to max excluding outliers) highlighting the association of PLK1 expression with good and poor responders to anastrozole both at baseline and on-treatment. p Value < 0.05 by Student t test is shown. Light blue dots—good responders at baseline; light red dots—poor responders at baseline; dark blue dots—good responders on-treatment (2 weeks); dark red dots—poor responders on-treatment (2 weeks). c PLK1 expression in ER-positive tumours of TCGA and Metabric according to CCND1 amplification. Data are presented as scatter dot plot with line indicating the median with range.

