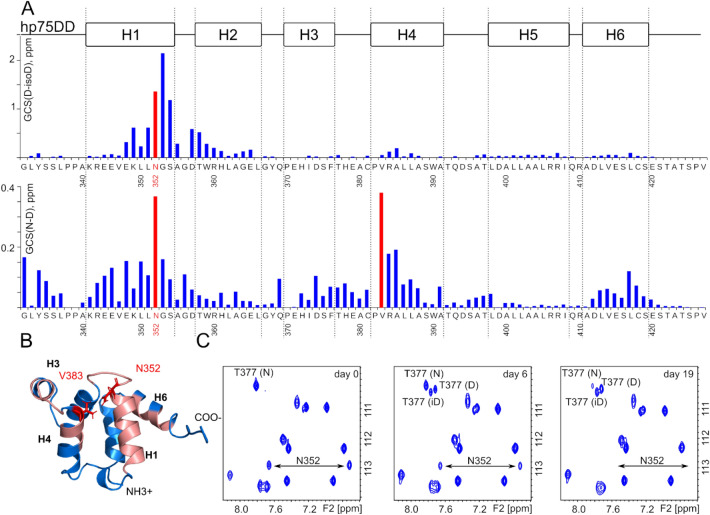
Figure 2.
Analysis of the death domain states by NMR. (A) Generalized chemical shift changes of cross-peaks in 1H,15N-HSQC spectra between the D352 and isoD352 (on top) and between N352 and D352 (at bottom) states of hP75DD. (B) The structure of the death domain (PDB:2N97) is colored with respect to the chemical shift changes upon deamidation. Red are the residues with GCS changes greater than 0.1 ppm. (C) A set of three fragments of 1H,15N-HSQC spectra of hP75DD in 50 mM phosphate buffer acquired at immediately, on the 6th day and 19th day after the sample preparation. Positions of Asn352 sidechain NH2-group are shown, as well as of three well-resolved signals, corresponding to the different states of Thr377. The figure was prepared using the program Inkscape 0.92 (https://inkscape.org/).

