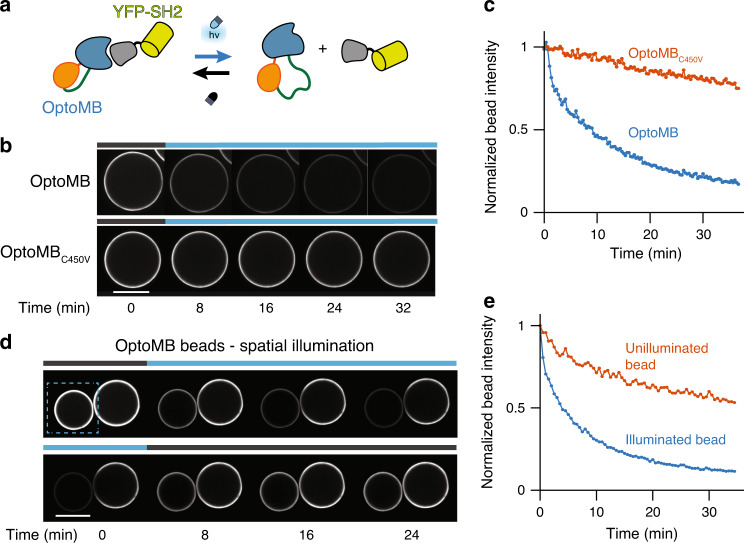
Fig. 2. In vitro characterization of OptoMB using agarose beads.
a Schematic diagram of OptoMB and YFP-SH2 darkness-dependent interaction. In the dark, OptoMB binds to the SH2 domain of YFP-SH2 fusion; upon blue light stimulation, the AsLOV2 domain disrupts the HA4 domain of OptoMB, reducing its affinity for SH2. b Time course of fluorescence microscopy images of YFP-SH2 binding to agarose beads conjugated with OptoMB (top panel) or OptoMBC450V as control (lower panel). Starting with beads incubated in the dark, time course begins upon blue light stimulation (t = 0), followed by a sequence of images taken every 8 min for a total of 32 min (see Supplementary Movie 2). The bar on top of each time course indicates when the illumination (450 nm) is on (blue) or off (gray) c Quantification of the time course fluorescence microscopy experiments shown in b for the beads coated with OptoMB (blue) and the ones coated with the light-insensitive control OptoMBC450V (orange). d Light-enabled spatial control of OptoMB binding demonstrated in two OptoMB-coated agarose beads incubated in a circulating solution of YFP-SH2. The blue rectangle in the left panel indicates the area used to illuminate only one bead. The top panel shows YFP-SH2 unbinding in illuminated area as beads go from darkness to 24 min of illumination. The bottom panel shows illuminated bead recovery (reversibility) after turning off the blue light for another 24 min (see Supplementary Movie 3). e Quantification of spatially controlled binding experiments of YFP-SH2 to two OptoMB-coated agarose beads, shown in d, showing normalized YFP fluorescence intensity of both illumined (blue) and unilluminated (orange) beads over time. Scale bars (white) represent 100 μm.

