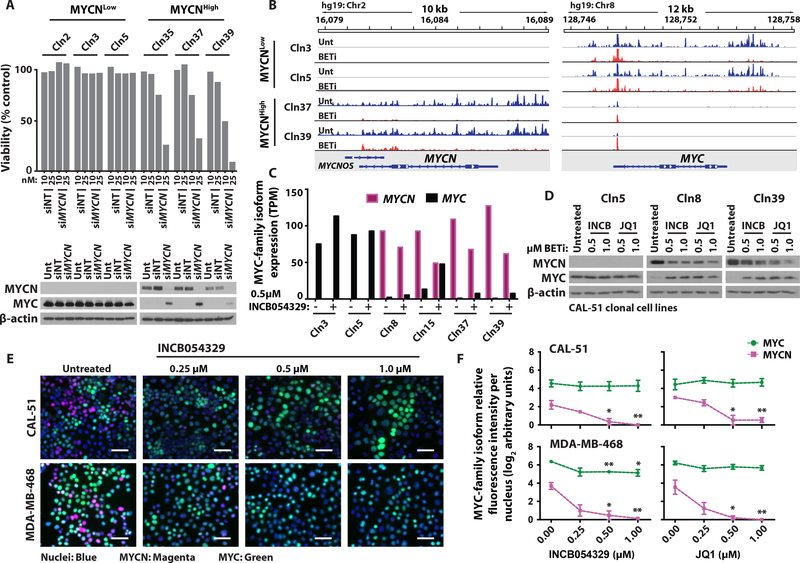
Fig. 5. Evaluation of MYC-family isoform expression after BETi treatment.
(A) Top: Viability of MYCNLow and MYCNHigh cell lines after siRNA-mediated knockdown using non-targeting (siNT) or anti-MYCN (siMYCN) siRNAs for 96 hours. Data shown represent the mean of three technical replicates. Bottom: Immunoblot analysis of MYCN, MYC, and β-actin in MYCNLow and MYCNHigh cell lines after the described knockdown with 25 nM siRNAs. (B) Genome viewer showing sequencing alignment tracks of nascent transcript PRO-seq mapping at the MYCN and MYC gene loci for the two indicated MYCNLow and MYCNHigh cell lines after treatment with DMSO control (Unt, blue) or 0.5 μM INCB054329 (BETi, red) for 15 minutes. (C) MYCN and MYC expression (TPM) in the two indicated MYCNLow (Cln3 and Cln5) and four MYCNHigh (Cln8, Cln15, Cln37, and Cln39) cell lines after treatment with 0.5 μM INCB054329 for four hours. (D) Immunoblot analysis of MYCN, MYC, and β-actin in three of the cell lines described in C after treatment with 0.5 and 1.0 μM INCB054329 or JQ1 for 24 hours. (E) MYC-family isoform TSA-IF on two MYCN-expressing TNBC cell lines (MDA-MB-468 and CAL-51) after 0, 0.25, 0.5, or 1.0 μM INCB054329 or JQ1 for 24 hours. Colors represent cell nuclei (blue), MYCN (magenta), and MYC (green). Scale bar, 50 μm. (F) Quantification of fluorescence intensity per nucleus for MYCN and MYC after BETi treatments described in E. Data shown represent the median ± SEM of three biological replicates. Student’s t-test between untreated and BETi-treated cells, *p<0.05, **p<0.01.

