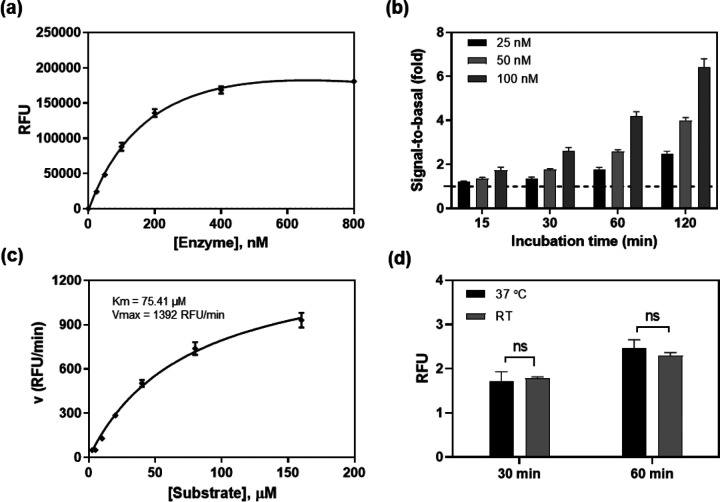
Figure 2.
SARS-CoV-2 3CLpro enzyme assay optimization. (a) Concentration-response curve of enzyme titration. With a fixed concertation of substrate (20 μM), the fluorescent intensity increased with enzyme concentrations. The linear response was observed at low enzyme concentrations. Measurement was conducted 2 h after initiating the reaction at RT. (b) The signal-to-basal (S/B) ratios of three enzyme concentrations within the linear range, at various incubation times. Dotted line represents the S/B = 1. (c) Enzyme kinetics. Michealis-Menton plot exhibited a Km of 75.41 μM and Vmax of 1392 RFU/min for SARS-CoV-2 3CLpro. (d) The S/B ratios determined at RT and 37 °C. No difference was observed in 1 h incubation between the two temperatures.

