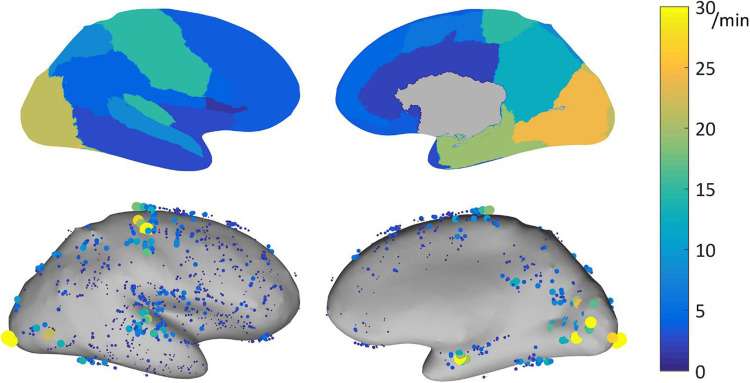
Figure 2.
Physiological ripple (80-250 Hz) rate results for bipolar channels recorded with DIXI electrodes, represented on the inflated cortex. Top: 95th percentile of the physiological ripple rate per brain region. Bottom: rate of the individual channels. Each dot represents a channel, the size and color indicate its ripple rate (left: lateral view, right: medial view). Note is made that physiological ripple rates show marked interregional variations, with highest rates in eloquent cortical areas. Reproduced with permission Frauscher et al.20

