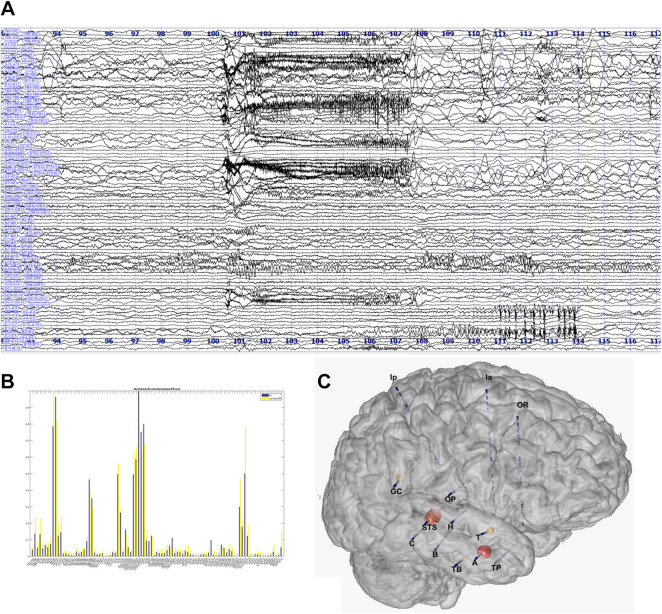
Figure 5.
Estimation of the Epileptogenicity Index in a case of complex pattern of seizure onset. A, SEEG bipolar traces. B, Estimation for each channels of the EI values. C, Representation of the EI values on a 3D MESH of the magnetic resonance imaging and electrodes. EI indicates Epileptogenicity Index.

