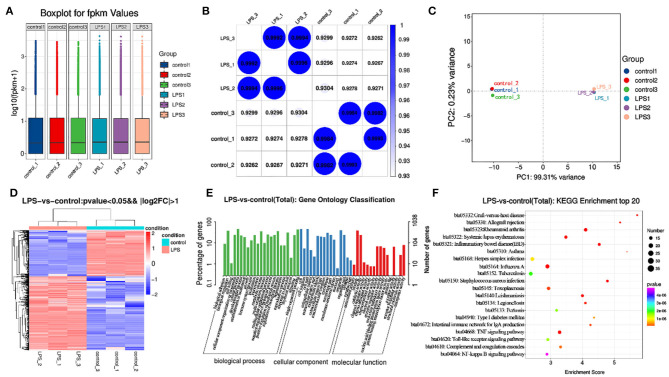
Figure 4.
Transcriptome analysis of control and LPS group. (A) Box line diagram in control and LPS group. The abscissa is the sample name and the ordinate is log10 (fpkm + 1). (B) Thermal diagram of the correlation coefficient between samples. The abscissa represents the name of the sample, and the ordinate represents the name of the corresponding sample. The color represents the size of the correlation coefficient. (C) PCA diagram in control and LPS group. (D) Screening for differentially expressed genes between control and LPS-induced BMEC. (E) GO enrichment. Horizontal axis is the GO entry name and the vertical axis is the –log10 p-value. (F) KEGG enrichment, top 20 genes.

