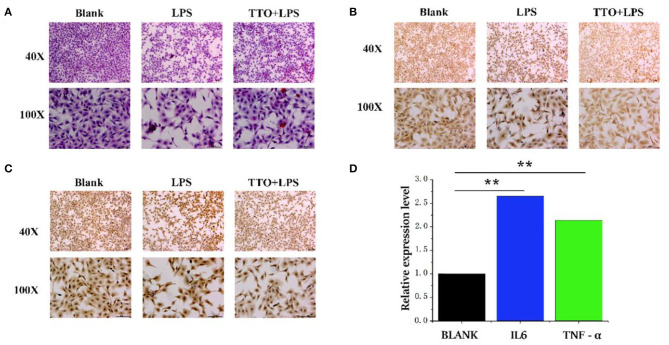
Figure 5.
Tea tree oil induced the expression changes of TNF-α and IL 6 in BMEC. (A) HE staining of BMEC in LPS (200 μg/ml) and TTO (0.008%) + LPS (200 μg/ml) of 12 h; (B) TNF-α immunohistochemical of BMEC in LPS (200 μg/ml) and TTO (0.008%) + LPS (200 μg/ml) of 12 h; (C) IL-6 immunohistochemical of BMEC in LPS (200 μg/ml) and TTO (0.008%) + LPS (200 μg/ml) of 12 h. (D) Sequencing results of TNF-α and IL 6 expression level. Black bar represents BLANK; blue bar represents IL6; green bar represents TNF-α. Data were presented as means ± s.d. of at least three independent experiments, **P < 0.01 using two tailed student t-test.

