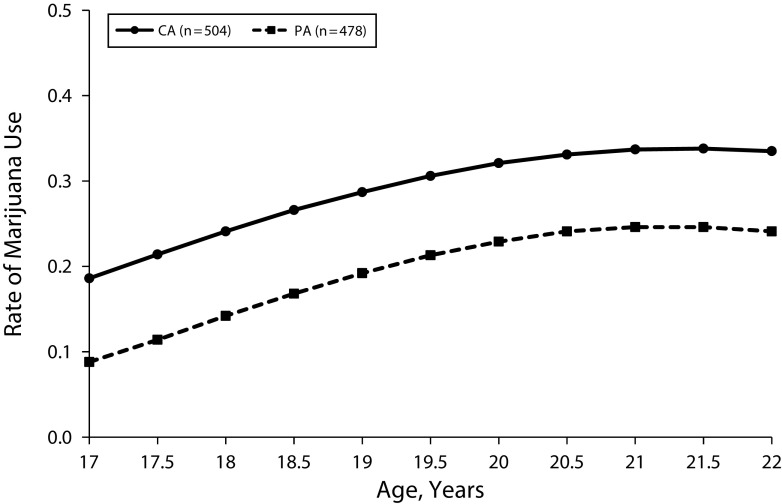
FIGURE 1—
Logistic Growth Curve Models of Rates of Marijuana Use, by Age: California and Pennsylvania, 2015–2018
Note. Changes in marijuana use over age were significant for both states (linear age: b = 0.072, P < .001; quadratic age: b = −0.001, P = .001). Nonsignificant age-by-state interactions suggest that age-related increases in marijuana use were similar for California and Pennsylvania (linear age: P = .414; quadratic age: P = .757). Means are depicted. Race/ethnicity, socioeconomic status, day of week, and interview time point were included in the analysis as covariates.

