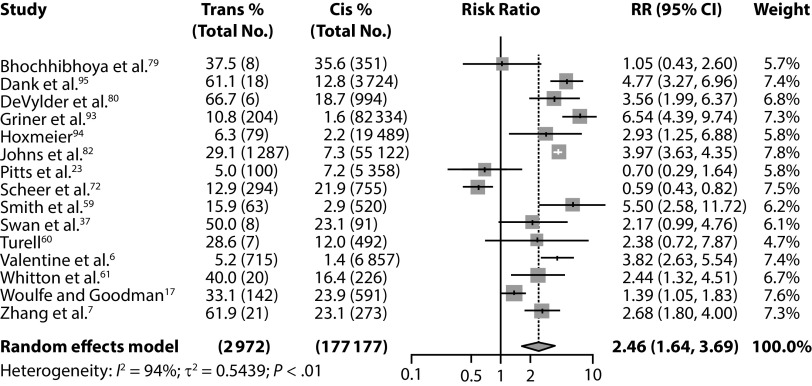
FIGURE 3—
Forest Plot Comparing Prevalence of Sexual IPV Victimization Between Transgender and Cisgender Participants Across 15 Studies That Included Transgender and Cisgender Participants
Note. CI = confidence interval; IPV = intimate partner violence; RR = risk ratio. Johns et al.82 provided unweighted prevalence data; the raw number/total number is reported here and differs from weighted prevalence percentage reported in the original article. Smith et al.59 included estimates for victimization during adolescence, young adulthood, adulthood, and past year. The estimates for young adulthood were included here because they had the greatest number of events for estimate stability. Results were qualitatively similar when other time periods were used in a sensitivity analysis. Whitfield et al.83 and Griner et al.93 used data from the same study; only Griner et al.93 was included in the meta-analysis. Woulfe et al.17 included past-year and adult IPV. The estimates for adult IPV were included because they had the greatest number of events for estimate stability. Whitton et al.61 provided transgender prevalence data but not cisgender prevalence data when requested from the authors. Cisgender prevalence was estimated by applying their reported adjusted odds ratio of 3.42 (95% CI = 1.85, 6.33).

