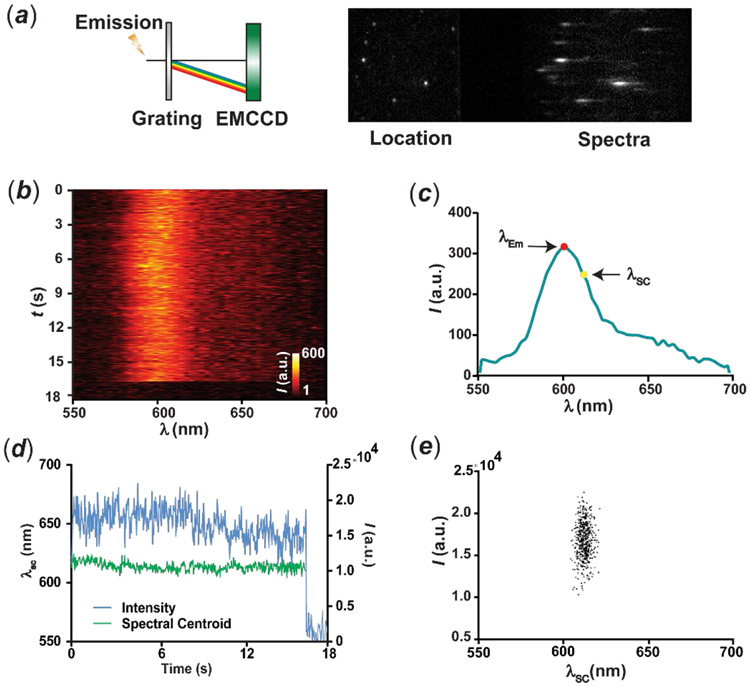
Figure 3.
Schematic representation (a) of the optical setup for high-throughput SMS and representative frames capturing the locations and emission spectra of individual molecules concurrently. Single-molecule emission spectra recorded over time (b), averaged emission spectrum before photobleaching (c), intensity and spectral-centroid evolution (d) of a single BO molecule over a time course of 18 s and scatterplot (e) of the emission intensity against the spectral centroid of the single molecule measured in each consecutive frame before photobleaching.

