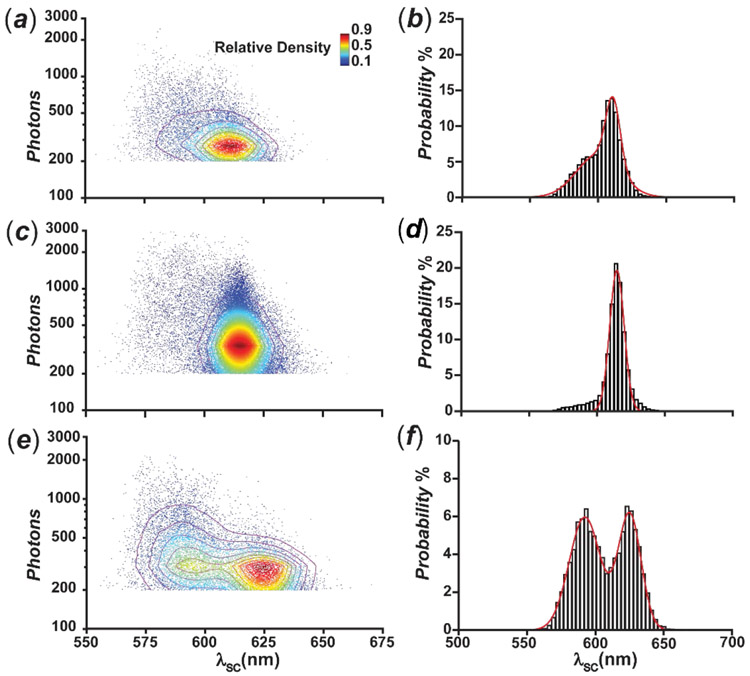
Figure 4.
Scatterplots (a, c and e) of the emission intensity against the spectral centroid with the relative density of distribution and histograms (b, d and f) of the spectral-centroid distribution of BO, BT and NBT respectively. The color bar and 2D contour indicate the relative density of the detected single molecules in different regions of the scatterplot.

