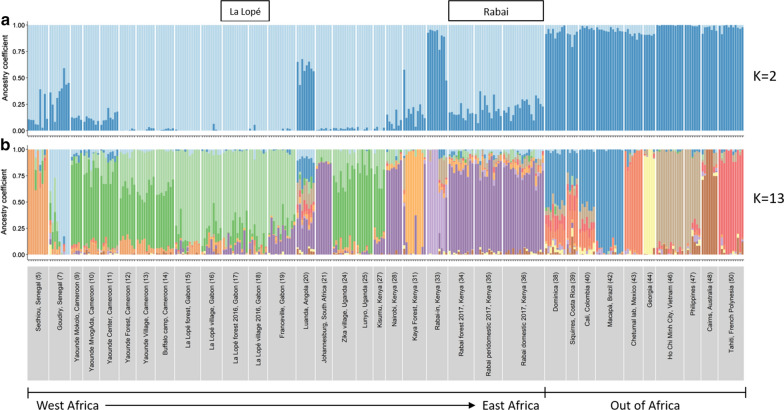
Fig. 2.
Genetic ancestry of the La Lopé and Rabai populations reported here (boxed names above figure) with a reference panel of the global populations of Ae. aegypti, estimated using 23,767 SNP loci in LEA with K = 2 (a) and K = 13 (b). Each bar represents one individual. Different colors represent different genetic clusters, and the proportion of a color indicates the probability of an individual assigned to that genetic cluster. Population names and regions are listed on the x-axis. The numbers in the parentheses correspond to the population index in Additional file 1: Table S1 (column “ID”)

