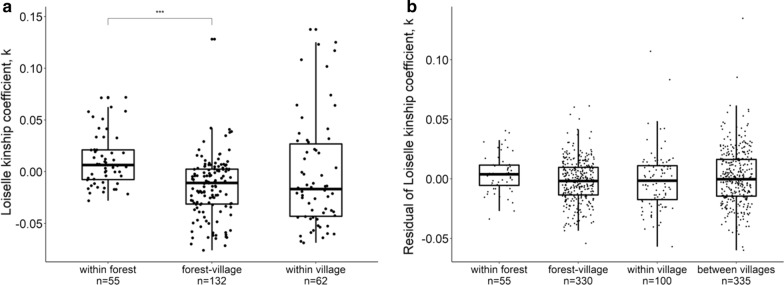
Fig. 4.
Individual pairwise kinship coefficients of mosquito samples from La Lopé (a) and Rabai (b). Each point represents one mosquito pair. a For La Lopé samples, mosquito pairs are grouped into three categories with the number of pairs labeled on the x-axis. Statistically significant differences between groups are determined by ANOVA with multiple comparisons by t-tests, and indicated by the brackets (significance levels: *P < 0.05, **P < 0.01, ***P < 0.001). b Residuals of the kinship coefficients in Rabai after removing distance effects grouped into four categories, with the number of pairs labeled on the x-axis. The boxplots show the median (the horizontal bar), interquartile range (IQR, the box), and 1.5 × IQR above and below the IQR (the vertical bar)

