Figure 1.
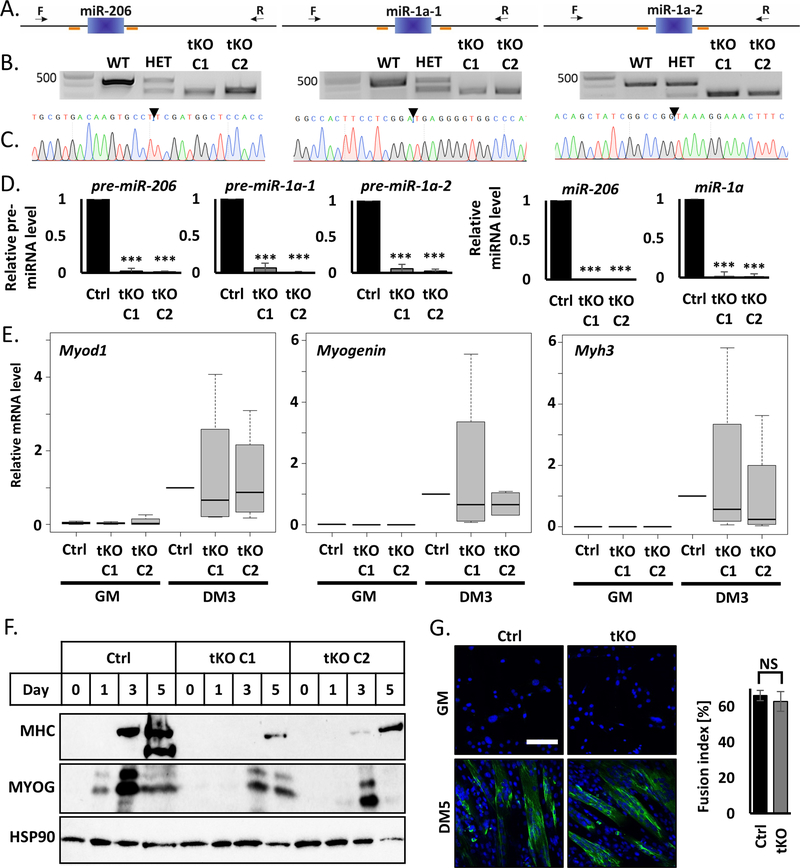
Simultaneous knockout of miR-206, miR-1a-1 and miR-1a-2 in C2C12 murine myoblast does not block cell differentiation
A) Scheme of CRISPR/Cas9 experiment design. Blue blocks represent genes, orange lines sgRNAs sequences and black arrow genotyping primers localization. Left: miR-206, middle: miR-1a-1, right: miR-1a-2.
B) Representative picture of PCR genotyping results of triple KO C2C12 cells. Left: miR-206, middle: miR-1a-1, right: miR-1a-2. Top band – wild-type size, bottom band – KO size.
C) Representative picture of Sanger sequencing confirmation of the genotyping PCR product in tKO C1 C2C12 clone.
D) qRT-PCR analysis of differentiating (DM3) control cells (Ctrl) and triple KO clones (tKO C1 and tKO C2). Levels of pre-miRNAs were normalized to Gapdh and miRNAs – to U6 snRNA. Levels are shown relative to control cells (Ctrl DM3). Values represent three biological replicates, presented as mean +/− SEM. Statistical significance was calculated using t-student test. (***) indicates p-value =< 0.001.
E) qRT-PCR analysis of proliferating (GM) and differentiating (DM3) control cells (Ctrl) and triple KO clones (tKO C1 and tKO C2). Levels of Myod1, Myogenin and Myh3 mRNAs were normalized to Gapdh and shown relative to control cells (Ctrl DM3) in box and whiskers plots. Values represent four biological replicates, black line represents median. Statistical significance was calculated using t-student test.
F) Representative Western blot of time course of differentiation (GM, DM1, DM3, DM5) of control cells (Ctrl) and triple KO clones (tKO C1 and tKO C2). Protein levels for MYOGENIN and MHC were measured. HSP90 serves as a loading control.
G) Immunofluorescence analysis of fixed cells 5 days after differentiation (DM5). Cells were immunostained with antibodies against MHC. Hoechst 33342 was used to visualize nuclei. Quantification of the fusion index is presented on the right side. White line = 200μm.

