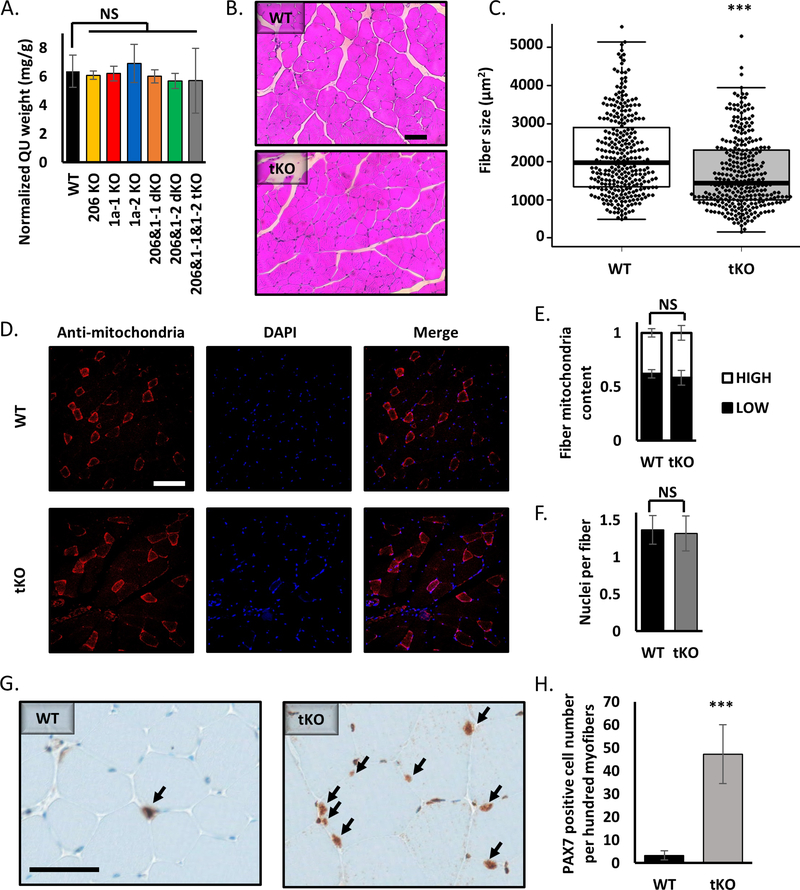
Figure 5.
Knockout of miR-206, miR-1a-1 and miR-1a-2 leads to smaller muscle fiber diameter, but does not alter the content of mitochondria or nuclei in skeletal muscles.
A) Quadriceps muscle (QU) weight from animals used in this study. Statistical significance was calculated using t-student test. N = 5 for all group, except miR-206&1–1&1–2 tKO, where N=2.
B) Representative picture of hematoxylin and eosin (H&E) staining of quadriceps muscle cross-section from WT and tKO mice. Black line = 100μm.
C) Quantification of average fiber size based on H&E staining. Statistical significance was calculated using t-student test. (***) indicates p-value =< 0.001. N = 300 fibers per group.
D) Representative picture of anti-mitochondria staining of quadriceps muscle cross-section from WT and tKO mice. White line = 200μm.
E) Quantification of fiber mitochondria content based on anti-mitochondria staining. High mitochondria content fibers represent type I and IIa, low – type IIb and IId. Statistical significance was calculated using t-student test. N = 600 fibers per group.
F) Quantification of nuclei per fiber number based on DAPI (nuclei) and anti-mitochondria (fibers) staining. Statistical significance was calculated using t-student test. N = 600 fibers per group.
G) Representative picture of PAX7 immunohistochemistry of quadriceps muscle cross-section from WT and tKO mice. Black arrows point to the PAX7 positive cells. Black line = 50μm.
H) Quantification of PAX7 positive cell number based on IHC. Statistical significance was calculated using t-student test. (***) indicates p-value =< 0.001.

