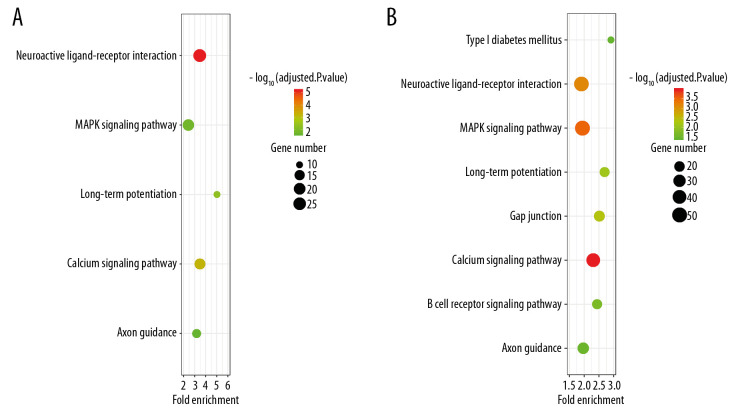
Figure 6.
Bubble plot for the enriched Kyoto Encyclopedia of Genes and Genomes pathways of the Alzheimer’s disease (AD)-related differentially expressed genes (DEGs) and the SIRT3-related DEGs. (A) The enriched pathways of the SIRT3-related DEGs. (B) The enriched pathways of the AD-related DEGs. The size of the bubble represents the gene number enriched in that pathway, and the color of the bubble represents the adjusted P-value of the pathway. The X axis represents the fold change of the pathway.

