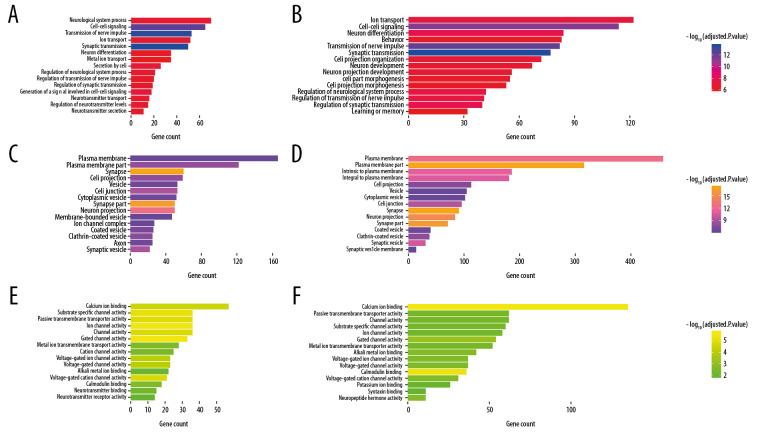
Figure 7.
Box plot for enriched Gene Ontology biological process, cellular component, and molecular function categories of the Alzheimer’s disease (AD)-related differentially expressed genes (DEGs) and the SIRT3-related DEGs. (A, B) Top 15 enriched biological processes of the SIRT3-related DEGs and the AD-related DEGs, respectively, ranked by adjusted P-value. (C, D) Top 15 enriched cellular components of the SIRT3- and AD-related DEGs, respectively. (E, F) Top 15 enriched molecular functions of the SIRT3- and AD-related DEGs, respectively. The color of the box represents the adjusted P-value of the entities, and the X axis represents the gene number involved in the entity.

