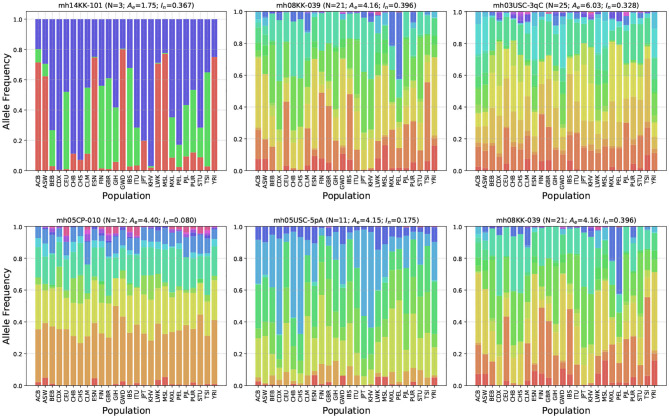
Figure 4.
Allele frequency distributions for six representative microhaplotype markers. Shown above each plot is the marker's name, the number of observed haplotypes (N), the average effective number of alleles (Ae), and the informativeness for assignment (In). Different colors correspond to distinct haplotypes. Holding In roughly constant, the top row shows relative allele frequencies for three microhap markers with low, medium and high Ae values. Holding Ae roughly constant, the bottom row shows relative allele frequencies for three microhap markers with low, medium, and high In values.

