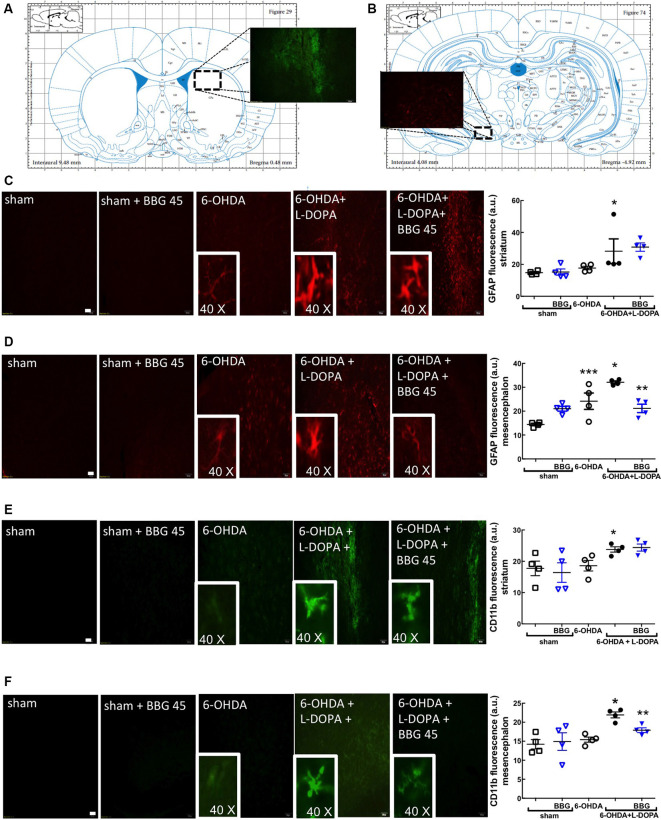
Figure 4.
The P2X7R antagonist, brilliant blue G (BBG), prevented astrocytic and microglial alterations in the striatum (A) and substantia nigra (B) of hemiparkinsonian rats suffering from L-DOPA-induced dyskinesia. Rats were either sham-operated or challenged with 6-OHDA (unilateral striatal injection of 18 μg/3 μl) and later treated either with saline or L-DOPA (30 mg/kg, v.o. daily) or L-DOPA plus BBG (45 mg/kg, IP daily, 30 min before L-DOPA), before being sacrificed for preparation of either coronal brain sections (50 μm thick) or extracts from the striatum or substantia nigra for Western blot analysis. (A) Representation from the rat brain Atlas of Paxinos and Watson (2005) at 0.48 mm from bregma, illustrating the site of a collection of striatal sections (50 μm thick) in three series of six sections around the three 6-OHDA injection sites and (B) representation at −4.92 mm from bregma, illustrating the site of a collection of nigral sections (50 μm thick) in three series of six sections; the insert photograph shows an example of a striatal (A) and nigral regions (B) stained for CD11b from a 6-OHDA + L-DOPA treated rat. (C,D) Representative photographs (ordered as indicated in the bar graph showing the average staining values) of the immunohistochemical detection of the astrocyte marker, GFAP in the striatum (C) and nigra (D), where the inserts are the amplification of individually stained elements; bar values are medians and spreading intervals; *p < 0.05 vs. sham-operated, **p < 0.05 vs. 6-OHDA and ***p < 0.05 vs. 6-OHDA + L-DOPA, Mann–Whitney test (n = 4). (E,F) Representative photographs (ordered as indicated in the bar graph showing the average staining values) of the immunohistochemical detection of the microglia marker, CD11b in the striatum (E) and nigra (F), where the inserts are the amplification of individually stained elements; bar values are medians and spreading intervals; *p < 0.05 vs. sham-operated, **p < 0.05 vs. 6-OHDA and ***p < 0.05 vs. 6-OHDA + L-DOPA, Mann–Whitney test (n = 4). Scale bar: 100 μm.

