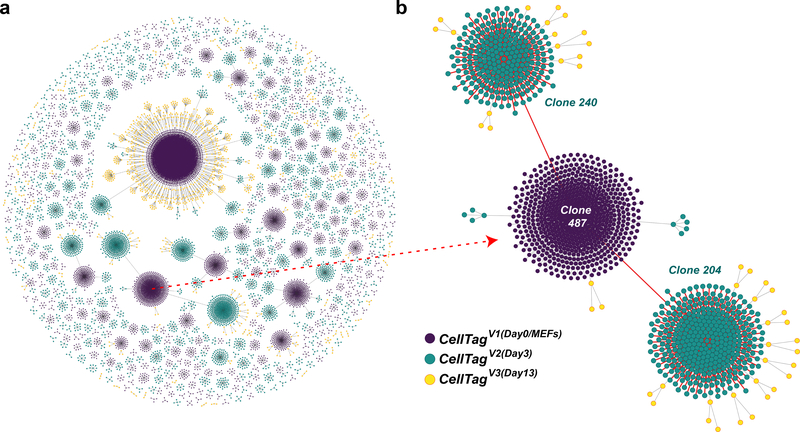
Fig. 10 |. Lineages reconstructed from a reprogramming time course.
a, Force-directed graph of clonally related cells and lineages reconstructed from a reprogramming time course (1,031 clones, 12,932 cells). All lineages and clone distributions can be interactively explored using our companion website, CellTag Viz (http://www.celltag.org/). b, A detailed example of a lineage tree, where we follow a CellTagV1-labeled clone (cells labeled as MEFs, at day 0) and its descendants. Each node represents an individual cell, and edges represent clonal relationships between cells. Purple, CellTagV1 clones; blue, CellTagV2 clones (cells labeled at day 3, after reprogramming initiation); yellow, CellTagV3 clones (cells labeled at day 13, after reprogramming initiation).

