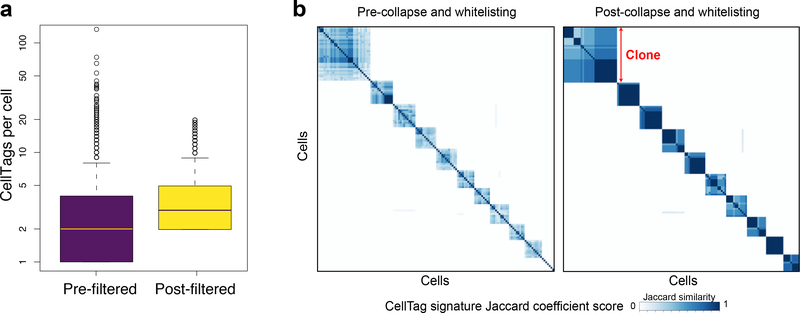
Fig. 4 |. CellTag filtering and error correction.
a, Mean CellTags per cell before and after CellTag pipeline filtering (n = 20,532 cells). The box plots show the median, first and third quantile and error bar with outliers. b, Pairwise correlation scores (Jaccard similarity) and hierarchical clustering of 10 major clones arising from this tag-and-trace experiment. Hierarchical clustering (Ward’s method (Ward.D2)) is based on each cell’s Jaccard correlation relationships with other cells, where each defined ‘block’ of cells represents a clone. Left panel: scoring and clustering of pairwise correlations, before whitelisting and filtering. Right panel: after whitelisting and filtering, pairwise correlations are stronger, and more cells are detected within each clone (n = 869 cells).

