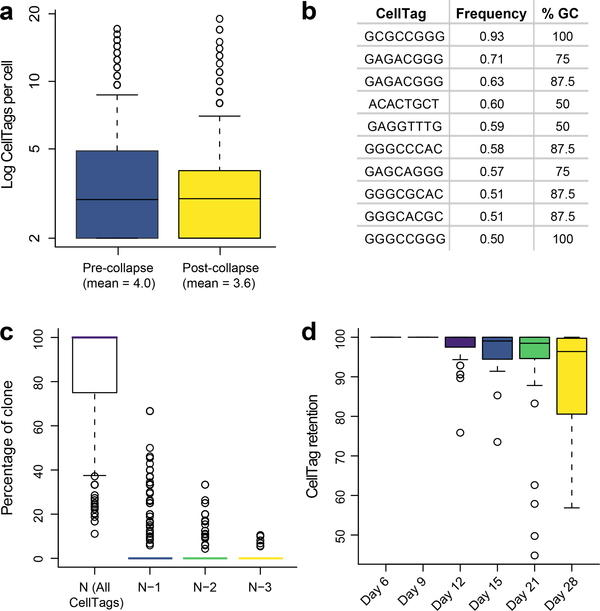
Fig. 8 |. Expected CellTag expression metrics.
a, Mean number of CellTags detected per cell (n = 19,581 cells) before and after CellTag error correction via collapsing. b, Sequences and %GC content of the 10 most frequently collapsed CellTags. c, Analysis of CellTag signatures across n = 339 clones, 4,130 cells. 84.6% (±1.3% s.e.m.) of cells have full CellTag signature (N), with 6.1% (±0.75% s.e.m.) of cells missing one CellTag (N−1) of the full signature. d, Percentage of cells within a clone retaining a full CellTag expression signature, measured over 22 days. The full signature for each clone is defined by aggregating all CellTags associated with the cells of a specified clone. Singleton CellTags, likely arising from uncorrected errors or cell lysis, are removed from the signature.

