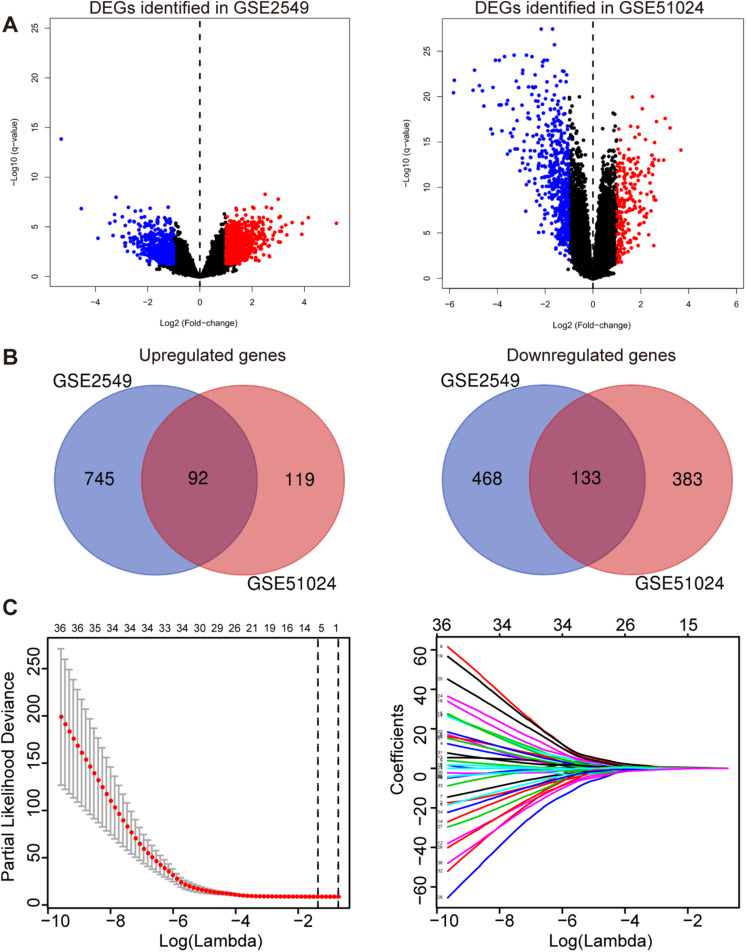
FIGURE 2.
Construction of the five-gene risk score model. (A) The volcano plots of GSE2549 and GSE51024 showing the DEGs between MPM tumor and normal tissues. |log2 Fold Change| > 1, q- < 0.05 for DEGs. Blue dot represents the significant downregulated genes and red dot represents the significant upregulated genes. (B) Venn of the DEGs in gene expression datasets GSE2549 and GSE51024. (C) Left panel: Plots of the cross-validation error rates. The two vertical dotted line represent the largest lambda value with minimum error (left) and 1- standard error (right); Right panel: LASSO coefficient profiles of the 36 genes detected by univariate cox regression analysis.

