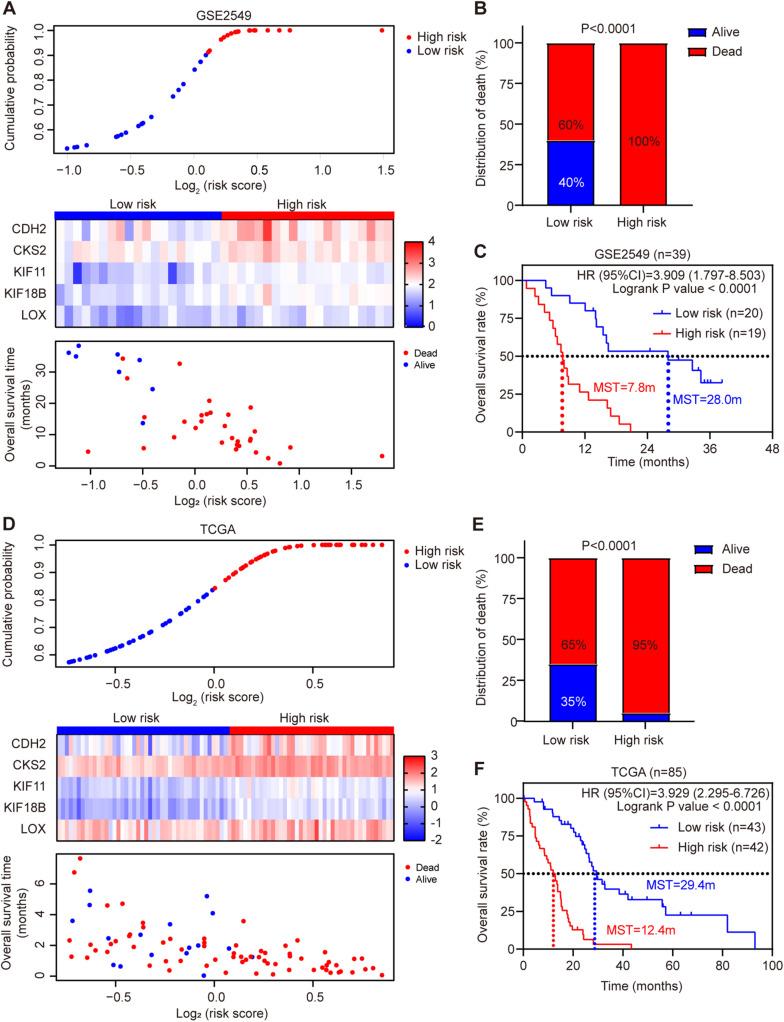
FIGURE 3.
Risk score distribution and validation of the five-gene signature risk score model in GSE2549 and TCGA datasets. (A,D) Upper panel: Low-risk and high-risk score distribution. Middle panel: the heatmap showing the five-gene expression profiles for each patient in low-risk and high-risk subgroups; Lower panel: the distribution of risk score with patient survival status. (B,E) Comparison of the MPM death rate in low-risk and high-risk groups. The death rate was higher in high-risk group than low-risk group. P-value was calculated by Chi-square test. (C,F) Kaplan-Meier survival analysis for the low-risk and high-risk patients (log-rank test).

