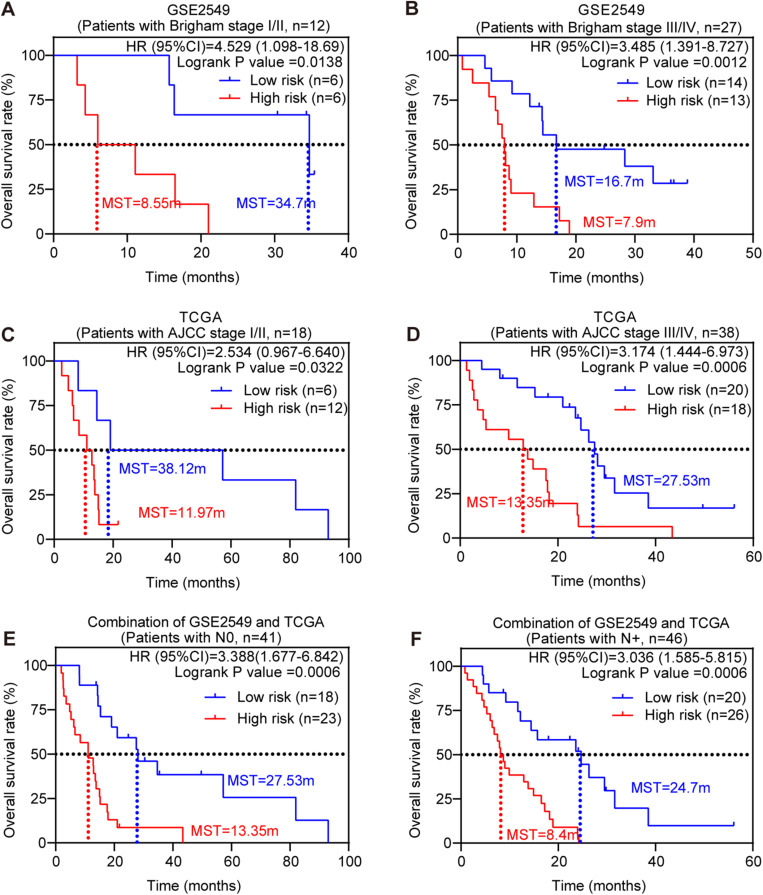
FIGURE 4.
Stratified survival analysis of the five-gene risk score model. Kaplan-Meier survival analysis for the patients with different clinical variables classified by the five-gene risk score model. (A) Patients in Brigham stage I/II; (B) patients in Brigham stage III/IV; (C) patients in AJCC stage I/II. (D) Patients in AJCC stage III/IV; (E) patients with lymph node negative; (F) patients with lymph node positive. P-values were calculated by Log-rank test.

