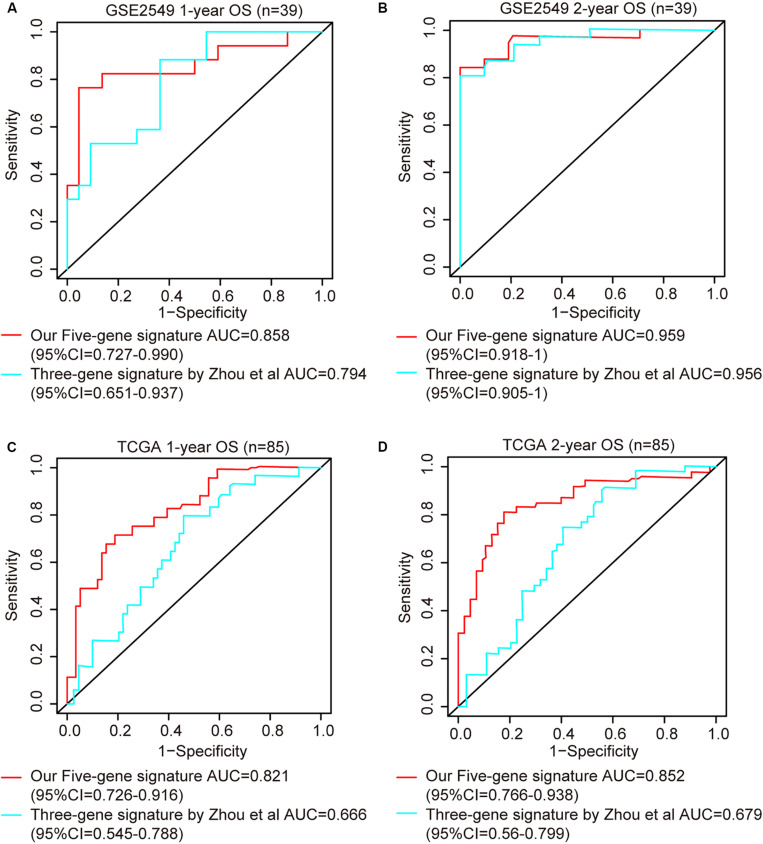
FIGURE 5.
ROC curves of five-gene risk score model compared with the literature model by Zhou et al. (2019). The X axis indicates false positive rate. The Y axis indicates true positive rate. One patient in GSE2549 dataset was not enrolled in the analysis because the clinical information was not available. (A) 1-year OS in GSE2549; (B) 2-year OS in GSE2549; (C) 1-year OS in TCGA; (D) 2-year OS in TCGA.

