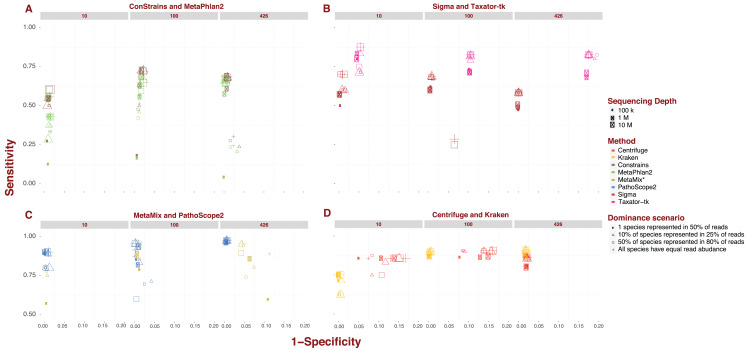
Figure 1. Sensitivity and specificity of tested software under diverse scenarios using 150 bp reads.
(A-D) show sensitivity and specificity for the eight software implementations for three different sequencing depths (100K, 1M, and 10M reads; size of the points) and four dominance scenarios (shape of the points). (A) shows results for marker gene approaches; (B) for whole genome approaches; (C) for approaches based on read reassignment; and (D) for approaches that implement reference library transformations.

