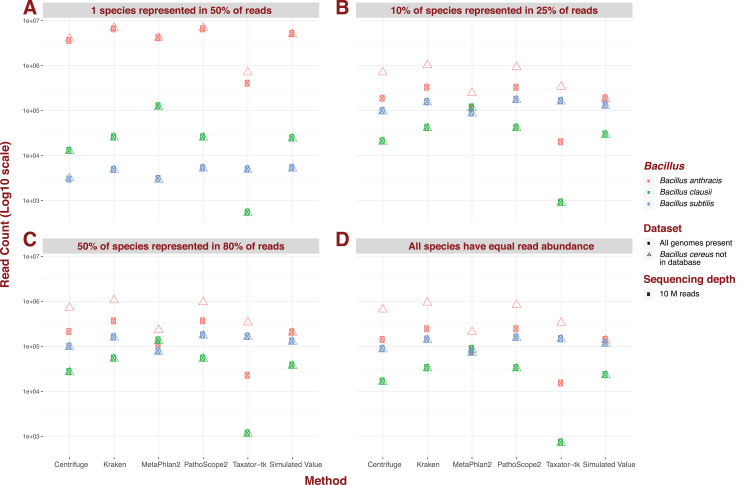
Figure 3. Example of the difference in Bacillus estimated abundance in datasets with (complete) and without (one more) the unreferenced Bacillus cereus.
Here, number of species (426), sequencing depth (10M) and read length (150 bp) are held constant. The largest change in abundance arises in Bacillus anthracis, the closest to Bacillus cereus. (A) One species represented in 50% of read abundance (e.g., acute infection); (B) dominance for 10% of species represented in 25% of the reads (e.g., polymicrobial infection); (C) 50% of species represented in 80% of the reads (e.g., normal microbiota); and (D) all species exhibit equal read abundance.

