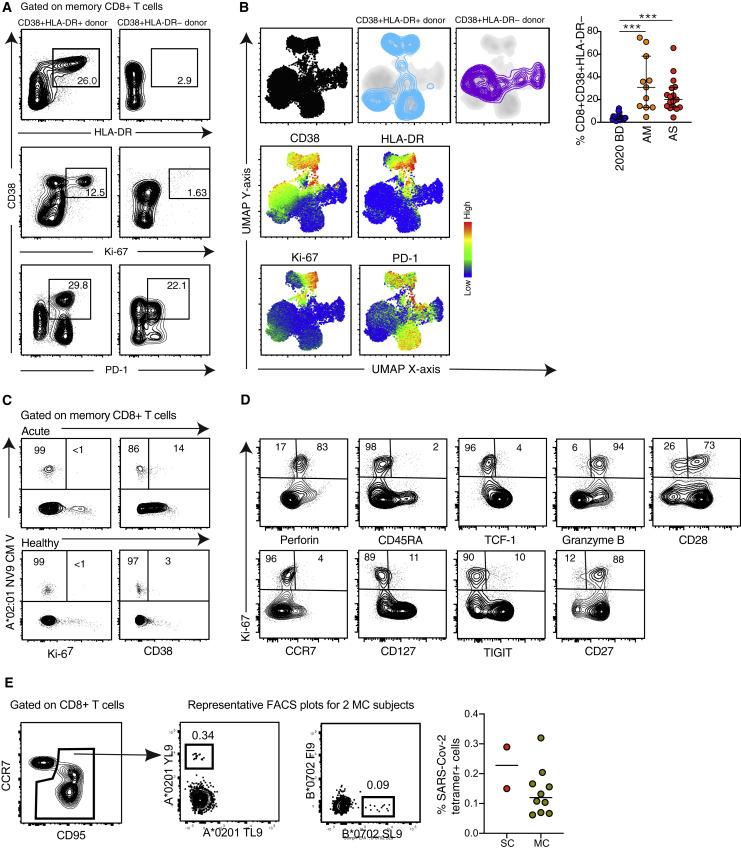
Figure S3.
Immune Activation Patterns in Acute COVID-19, Related to Figure 2
(A) Representative flow cytometry plots showing the expression of activation/cycling markers among memory CD8+ T cells in patients with acute severe COVID-19. Numbers indicate percentages in the drawn gates. (B) Top left: UMAP plots showing the clustering of memory CD8+ T cells by phenotype in relation to all memory CD8+ T cells (left). Bottom left: UMAP plots showing the expression of individual markers (n = 1 donor per group). Right: dot plot summarizing the frequencies of CD38+ HLA-DR− memory CD8+ T cells by group. Each dot represents one donor. Data are shown as median ± IQR. 2020 BD: healthy blood donors from 2020 (n = 18). AM: patients with acute moderate COVID-19 (n = 11). AS: patients with acute severe COVID-19 (n = 17). ∗∗∗p < 0.001. Kruskal-Wallis rank-sum test with Dunn’s post hoc test for multiple comparisons. (C) Representative flow cytometry plots showing the expression of activation/cycling markers among CMV-specific memory CD8+ T cells in a healthy control and a patient with acute severe COVID-19. Numbers indicate percentages in the drawn gates. (D) Representative flow cytometry plots showing the phenotype of Ki-67+ memory CD8+ T cells in a patient with acute severe COVID-19. Numbers indicate percentages in the drawn gates. (E) Left: representative flow cytometry plots showing SARS-CoV-2-specific tetramer+ CD8+ T cells in two donors from group MC. Right: dot plot summarizing the frequencies of SARS-CoV-2-specific tetramer+ CD8+ T cells in donors from groups MC (n = 10) and SC (n = 2).

