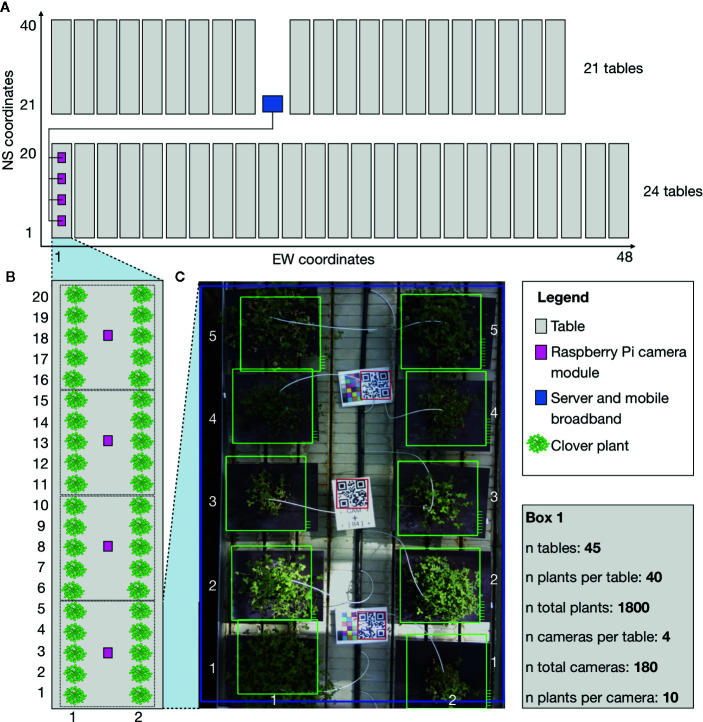
Figure 1.
Schematic showing the general setup of the phenotyping system and experimental setup. The schematic corresponds to the physical setup in the greenhouse. The grey boxes are moveable tables. The pink boxes are RPi camera modules fixed (2 m) over the tables in a fixed position. The blue box indicates the location of the central computer, which all of the camera modules were connected to. Green indicates locations of clover plants that were studied in the experiment. The camera modules are only shown for a single table, but camera modules were mounted over all tables with four per table. (A) A full schematic layout of the greenhouse with relative table placements. EW (East-West) coordinates and NS (North-South) coordinates in the greenhouse describing the physical locations of each plant. (B) Close-up schematic of a single table with the division of clover plants for the cameras. (C) A further close up of a picture from a camera. EW coordinates and NS coordinates for the individual pots used to identify the placement of each plant. Box (1) includes the raw number of tables, plants, and cameras, describing the full setup.

