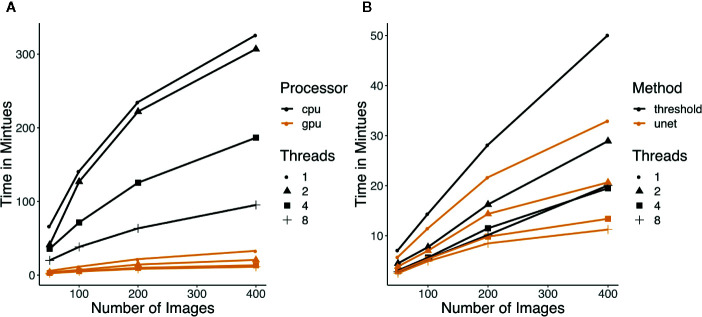
Figure 3.
(A) Running time of U-net using CPU versus GPU. Color indicates which processor was used and the shapes of the points represent how many threads were used for the running time measurement. (B) Running time of thresholding and U-net (GPU) with increasing number of images. Each run was done with 3 replicates and the median was taken. The colors represent which method was used and the shapes of the points represent how many threads were used for the running time measurement.

