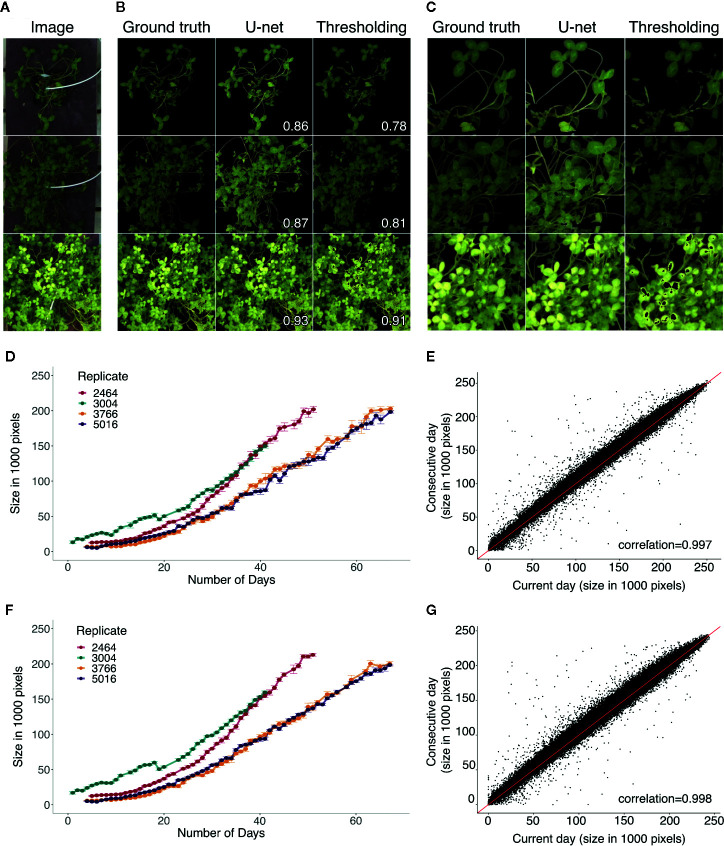
Figure 4.
(A) Three example images from the test set for segmentation. (B) Masks produced to the corresponding examples from (A), showing the ground truth mask and the predictions from U-net and thresholding. Corresponding Jaccard index (intersection over union) statistics between the ground truth and predicted masks are displayed. (C) Zoomed in examples on the masks showing regions in which the U-net improved the prediction compared to thresholding. (D, F) Growth curve examples from the same replicates from the two different rounds, with replicates 2,464 and 3,004 from round 1 and replicates 3,766 and 5,016 from round 2. Growth curves made using thresholding (D) and U-net (F). The units are the size of the plant area measured in the number of pixels from the predicted masks. (E, G) Change in plant size from the current day to the consecutive day across all days and plants using thresholding (E) and using U-net (G). The red line corresponds to a 1:1 relationship. Pearson correlations are shown on bottom right corners (E, G).

