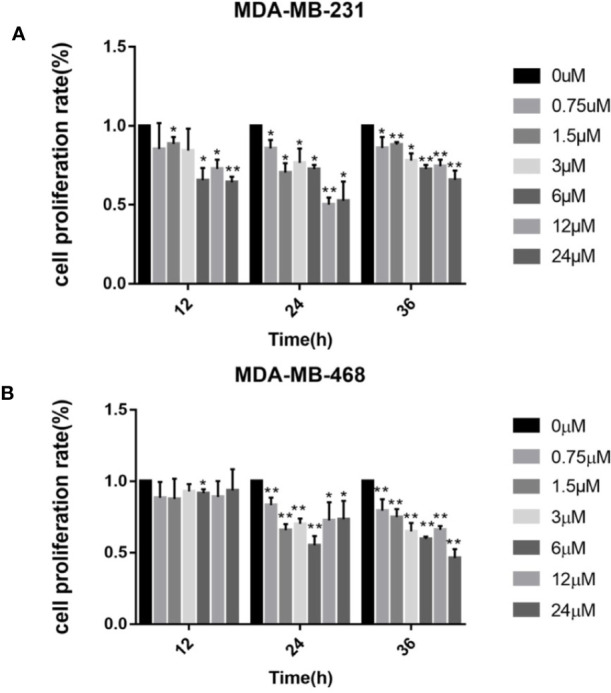
Figure 1.

Cell viability assay (MTT) of (A) MDA‐MB‐231 and (B) MDA‐MB‐468 cells treated with 0–24 μM of podophyllotoxin 12–36 h. The inhibition rate of the two kinds of cells treated by drugs was the highest at 24 h. Each data represents the mean ± SD from three independent experiments *p < 0.05, **p < 0.01.
