Figure 5.
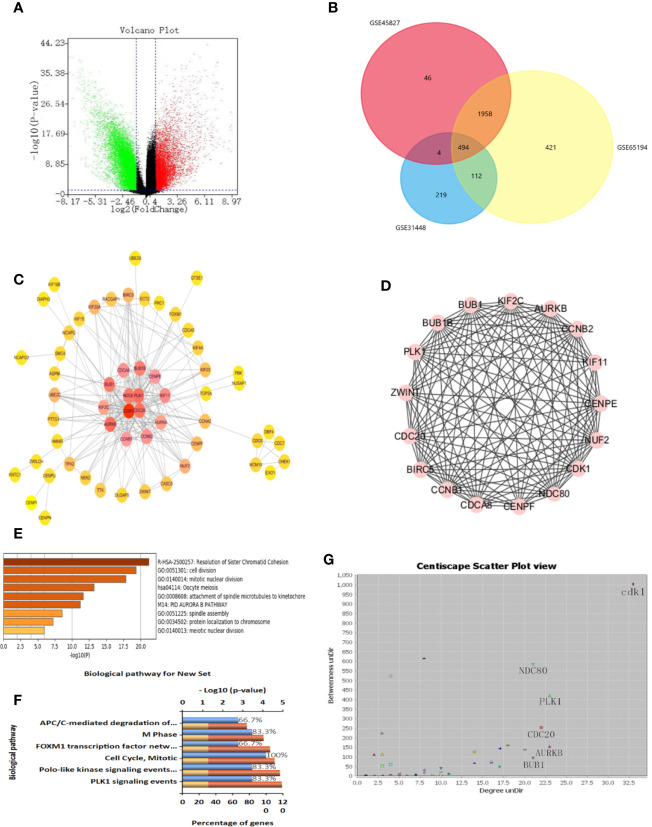
Identification of differential genes and key genes. (A) Volcanic maps of all the genes and identification of DEGs. (B) Venn diagram of GSE31448, GSE45827, and GSE65194. (C) protein-protein interaction (PPI) network of DEGs and screening of key genes. The color degree of the node is proportional to the degree of the node. The darker the color, the better the connectivity between genes. (D) Using MCODE to cluster in the huge gene (protein) network to construct functional modules, with a total of 14 nodes and 82 edges. The best protein module is selected through the score value of the node by MCODE, and its score value is 12.615. (E) Functional analysis of genes, including functional categories or cellular localization. The abscissa is the logarithm of the p-values with a base of 10 and a negative value; the vertical is different enrichment pathways. The higher the -log10 value ranked above, the smaller the p-values and the more significant the enrichment (the darker the color). (F) Enrichment analysis of GO and KEGG. Enrichment of key genes in KEGG pathway. The higher the proportion, the more enrichment in the pathway. (G) Protein-protein interaction network of DEGs. Selecting more valuable nodes according to degree UnDir and betweenness UnDir. CDK1, NDC80, PLK1, CDC20, AURKB, BUB1 were identified as key genes.

