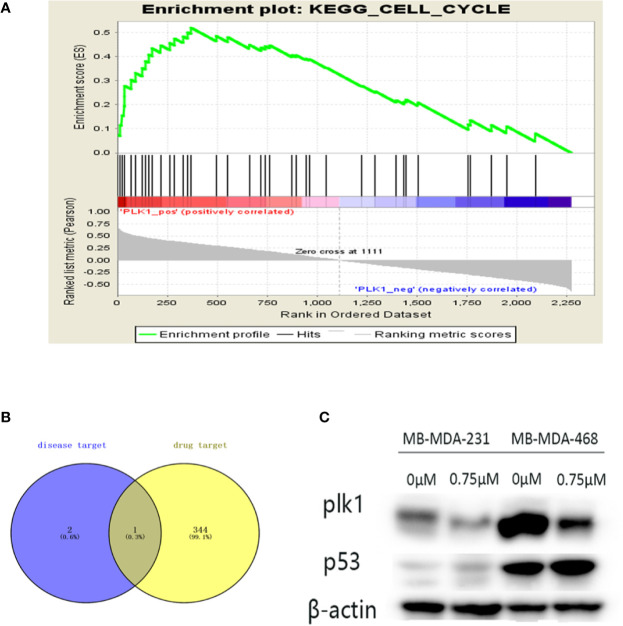
Figure 8.
Further screening of key targets. (A) Gene Set Enrichment Analysis (GSEA) enrichment of Polo-like kinase1 (PLK1) in cell cycle signaling pathway. NES=2.229, p-value=0, FDR-q-value=0.00213. (B) The Venn diagram is the intersection of key disease targets and drug targets. Purple: key target for triple-negative breast cancer (TNBC) disease, yellow: drug target. We end up with a common gene: PLK1. (C) The protein expression levels of p53 were assayed by Western blot. The expression of PLK1 protein decreased and the expression of p53 increased with the increase of podophyllotoxin in both cell lines.

