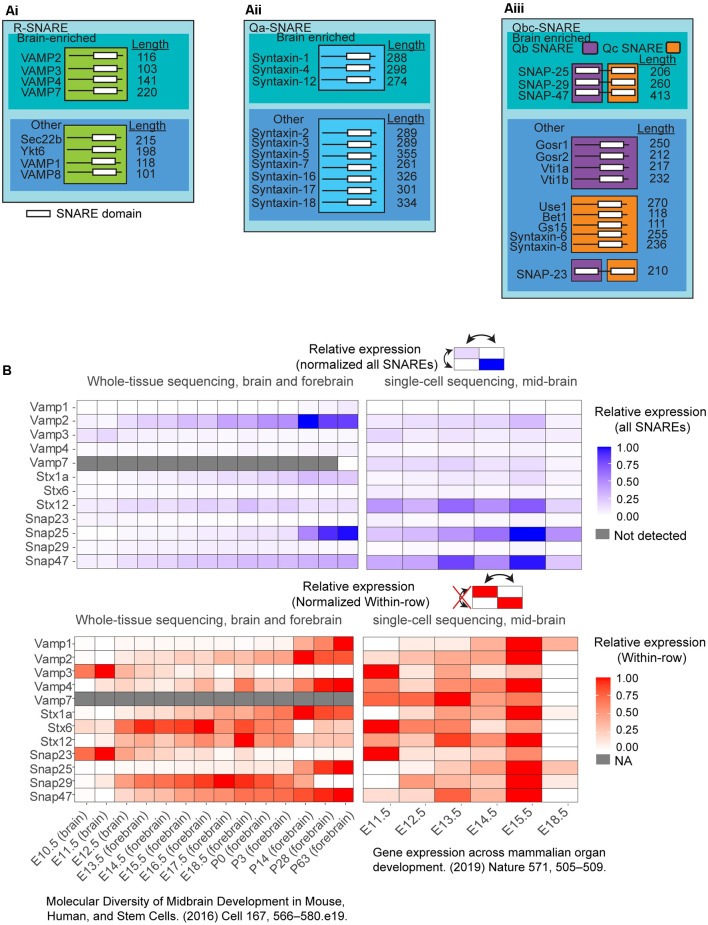
Figure 2.
(A) Selected list of the classified as Qabc-SNAREs and R-SNAREs and neuronally enriched SNARE expression in vivo in the murine brain. SNAREs are classified into: (Ai) R-SNAREs; (Aii) Qa-SNAREs; and (Aiii) Qbc-SNAREs. These SNAREs were further subset into brain-enriched or not brain-enriched. White bars in the illustration represent SNARE domains. (B) Expression from two different databases of select SNARE mRNA expression, one from whole-brain and forebrain sequencing, and another database from single-cell sequencing of the mid-brain over multiple developmental time points. SNARE expression was normalized to all SNAREs (blue) or normalized within-row (red) for identification of temporal peak expression for each individual. To compare across all SNAREs (blue), datasets of reads per kilobase of exon model per million mapped reads (RPKM) were filtered for SNARE expression. The expression data were normalized to the highest RPKM among all SNAREs was set to 1, and the lowest RPKM among all SNARES set to 0, and all SNAREs RPKMs were normalized between these two values. To compare SNARE expression within-row (red), the highest RPKM for each SNARE was set to 1, and the lowest RPKM was set to 0 separately for each SNARE.

