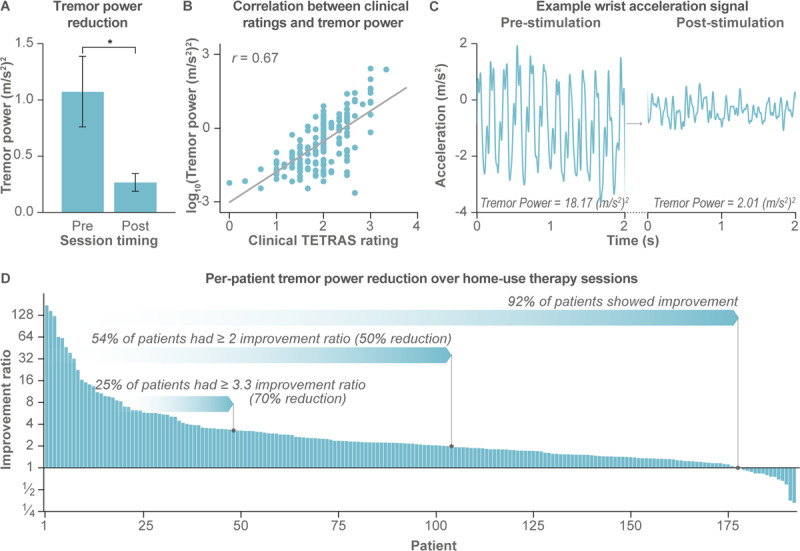
Figure 4.

Secondary endpoint from at-home accelerometer measures show improvement in tremor physiology with therapy. (A) Average tremor power decreased from pre-stimulation to post-stimulation (data represents 193 patients and 21,806 total sessions). Error bars represent ±1 SEM, and * indicates p < 0.0001. (B) Tremor power, computed from the triaxial acceleration signals, was correlated to the clinician-rated TETRAS postural hold rating (r = 0.67, p < 0.0001). (C) Example 3-second segment of the wrist acceleration time series along one of the three accelerometer axes with corresponding tremor power measures are shown for a single session before and after stimulation. (D) 92% of all patients had an improvement ratio > 1, indicating an improvement in tremor power from pre- to post-stimulation. Each bar represents a single-patient’s median improvement in tremor power from pre- to post-stimulation over all at-home stimulation sessions over three months (n = 193 patients).
