
Figure 3.
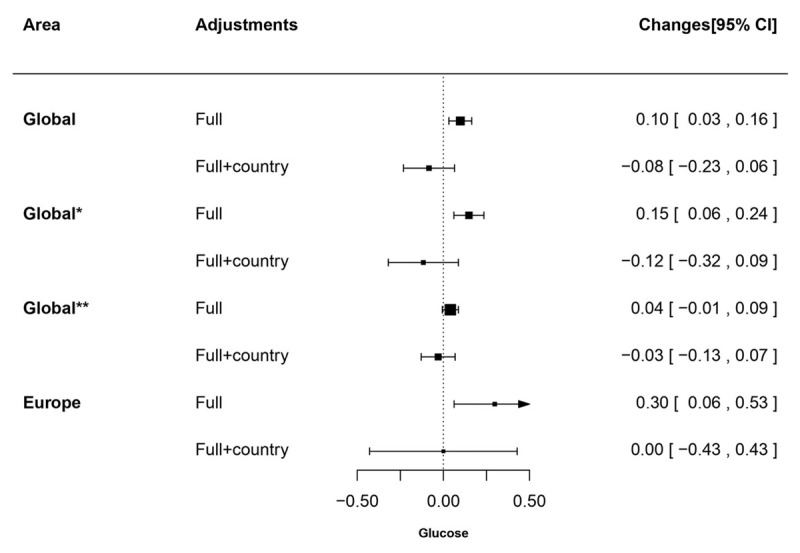
Changes (95% CI) in glucose increase in PM2.5 derived from World Health Organization.
All analyses were applied with generalized estimating equation model with centre clustered. ‘Full’ adjustment was sex, age, and risk factors (exercise, smoking status, and body mass index). ‘Full+country’ was sex, age, risk factors (exercise, smoking status, and body mass index), and country. Results are presented as changes in mmol/L (95% CI).
‘Global*’ presented results are based on all participating countries except China; ‘Global**’ presented results are based on all participating countries except Saudi Arabia.