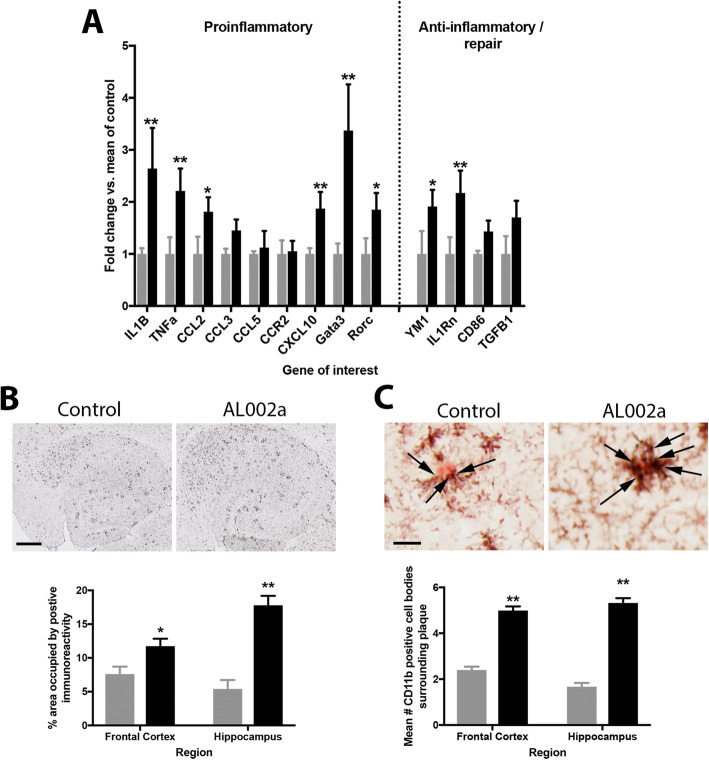
Fig. 4.
Panel a shows RT-PCR data obtained from the right hippocampus. All data are shown as fold-change relative to the mean of the control antibody treated mice. Data were analyzed using single, one-way ANOVA measures for each gene of interest, using a Bonferroni correction for multiple comparisons. Panel b shows the microglial activation (CD11b) in the hippocampus (images shown) and frontal cortex of control antibody or AL002a. Magnification = 40×, scale bar shown = 120 μm. Panel c shows the microglial clustering around an amyloid plaque. Arrows highlight microglial cell bodies. Magnification = 400×, scale bar shown = 12.5 μm. For all graphs, black bars are AL002a, and gray bars are control antibody. *P < 0.05, **P < 0.01

